HOT TOPICS LIST
- Strategies
- Stocks
- Buy
- Investing
- Brokers
- Psychology
- Interviews
- Accumulate
- Sell
- Hold
- Spotlight
- Websites
- Candlestick Corner
- Gold & Metals
- Options Trading
LIST OF TOPICS
TRADER'S NOTEBOOK
Technical Signals In The S&P
11/16/05 01:47:33 PM PSTby Dr. Charles B. Schaap
Is the S&P in an uptrend or a retracement? The average directional movement index and other indicators can show you where the market is going.
| If you watch TV, surf the Internet, or listen to the radio, chances are you've heard market experts discussing just how high the Standard & Poor's 500 index can go. Since March 2003, the S&P has been steadily climbing, gaining over 50% by November 2005, and many experts claim the market is getting ready to bust out. I agree it's ready to make a big move — but in which direction? A fresh look at technical signals in the S&P will provide some startling observations. STRENGTH OF THE S&P
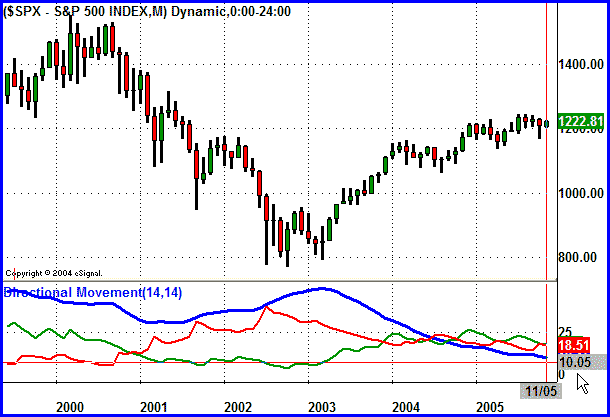
Figure 1: S&P MONTHLY. Here's a current ADX rating (blue line) of only 10 (weak).
Now let's take a closer look. Figure 1 shows where the S&P bottomed in 2003 with an ADX reading of over 45, indicating a very strong downtrend. Since then, the S&P has steadily risen in price while the value of ADX has steadily fallen. My ADX retracement rule indicates that the uptrend that started in 2003 is really a retracement of the downtrend that started at the 2000 market highs and ended in 2003.
ADX retracement rule: The ADX slope will rise during a strong trend and decline during a retracement of the trend. DIRECTION OF THE S&P Now, compare that to the +DMI that represents the current upward trend in the S&P. It is easy to see that the +DMI (green line) has failed to record a strong peak. Instead, +DMI and -DMI have crisscrossed each other without either of them expressing directional dominance. At the current time, the DMI lines are touching, meaning they are equal in value. While the S&P does have direction (up), my DMI equilibrium rule says it is directionally weak and lacks a dominant bull or bear force.
DMI equilibrium rule: When +DMI and DMI are below 25 and moving sideways, the trend has no dominant direction. The DMI lines are based on range expansion, a sign of directional force. Compared to the average range of the monthly bars prior to 2003, you can see that the bars after 2003 are significantly smaller. Again, this shows a lack of directional strength. Put another way, while the bulls are currently stronger than the bears, the bulls are not nearly as strong as the bears were before 2003. OTHER TECHNICAL SIGNALS
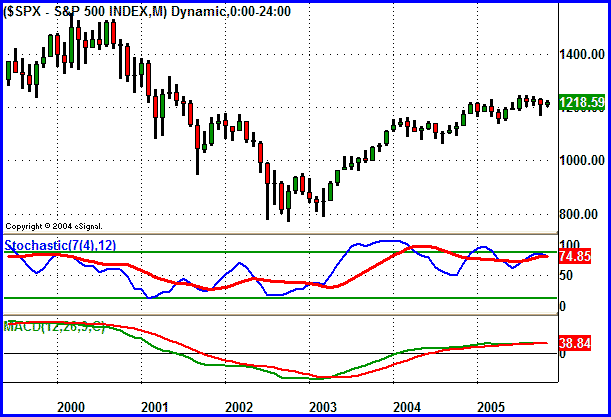
ADX indicator rule: When ADX is greater than 25, use trend indicators. When ADX is less than 25, use oscillator indicators. When a market is strongly trending, it is generally better to use a trend indicator such as the moving average convergence/divergence (MACD) for trading signals. This is because momentum oscillators such as stochastics tend to give many false signals, remaining overbought/oversold for extending periods. However, when the trend is weak, it is better to use oscillators. In Figure 2, we can compare both types of indicators and gain insight into the next move in the S&P.
Figure 2: OSCILLATORS. Here we compare both types of indicators.
The lower window of Figure 2 contains MACD, which gives signals when the fast line (green) crosses the slow line (red). It provided a great signal to enter long in early 2003 when the ADX was about 45 (strong trend). The fast line (green) crossed up through the slow line (red) on a successful test of the 2003 price lows. However, as explained previously, the current S&P trend is weak (ADX 15). You can see how poorly trend indicators work in these conditions. Since the second half of 2004, the MACD lines have been on top of one another, moving sideways and showing no momentum swings. Any crossover now would be hard to interpret due to the lack of separation between the MACD lines. In contrast, look at the same time period with stochastics (middle window). Stochastics have swings that are easily readable. There is clear separation between the fast line (%K, blue) and the slow line (%D, red), and crossovers are distinct. So what do stochastics tell us about the momentum and future direction of the S&P? The last three fast-line (%K) peaks have been progressively lower, while the price highs have been progressively higher. This represents bearish momentum divergence, a warning that price direction may be ready to change to the down direction. HEADING FOR A RETEST From these charts, ADX tells us that the monthly S&P trend is weak. The upward movement from 2003 represents an up retracement of the larger downtrend that started with the market bubble top in 2000. The DMI lines tell us that the S&P is directionally weak, while stochastics demonstrate bearish divergence. The current technical signals in the S&P indicate price will go down to retest the 2003 low.
Dr. Charles Schaap is a freelance writer, active trader, and analyst for StockMarketStore.com. Portions of this article concerning ADX are excerpts from his forthcoming technical book (to be published in 2006). Schaap can be contacted at traderdoc@sbcglobal.net. SUGGESTED READING Charts courtesy of eSignal Current and past articles from Working Money, The Investors' Magazine, can be found at Working-Money.com.
|
| E-mail address: | traderdoc@stockmarketstore.com |
PRINT THIS ARTICLE

Request Information From Our Sponsors
- StockCharts.com, Inc.
- Candle Patterns
- Candlestick Charting Explained
- Intermarket Technical Analysis
- John Murphy on Chart Analysis
- John Murphy's Chart Pattern Recognition
- John Murphy's Market Message
- MurphyExplainsMarketAnalysis-Intermarket Analysis
- MurphyExplainsMarketAnalysis-Visual Analysis
- StockCharts.com
- Technical Analysis of the Financial Markets
- The Visual Investor
- VectorVest, Inc.
- Executive Premier Workshop
- One-Day Options Course
- OptionsPro
- Retirement Income Workshop
- Sure-Fire Trading Systems (VectorVest, Inc.)
- Trading as a Business Workshop
- VectorVest 7 EOD
- VectorVest 7 RealTime/IntraDay
- VectorVest AutoTester
- VectorVest Educational Services
- VectorVest OnLine
- VectorVest Options Analyzer
- VectorVest ProGraphics v6.0
- VectorVest ProTrader 7
- VectorVest RealTime Derby Tool
- VectorVest Simulator
- VectorVest Variator
- VectorVest Watchdog


