HOT TOPICS LIST
- Strategies
- Stocks
- Buy
- Investing
- Brokers
- Psychology
- Interviews
- Accumulate
- Sell
- Hold
- Spotlight
- Websites
- Candlestick Corner
- Gold & Metals
- Options Trading
LIST OF TOPICS
THE OPTIMIZED TRADER
Stage Analysis With Trend Channels
12/07/05 01:11:52 PM PSTby David Penn
Price channels show when the S&P 500 went into acceleration mode in November 2005.
| Of the many gems in Stan Weinstein's classic book on financial speculation, Secrets To Profiting In Bull And Bear Markets, his remarks on "stage analysis" must be counted among them. What does Weinstein mean by "stage analysis"? In a chapter titled "One glance is worth a thousand earnings forecasts," he writes:
Once you grasp this profitable technique, the market game for stocks, options, mutual funds, commodities, or you-name-it will become much easier and more profitable. You'll be able to flip through any chart book and immediately spot those few stocks worthy of further study and possible action, while eliminating the scores of issues that aren't worth another moment of consideration no matter how exciting the newspaper headlines. Just remember this basic fact: any stock has to be in one of four market stages, and the trick is to be able to identify each one. The four basic stages of a major cycle are: (1) The basing area, (2) the advancing stage, (3) the top area, and (4) the declining stage.
Anyone even casually knowledgeable about technical analysis will likely be able to understand what Weinstein means by these four different stages. In fact, they are almost commonsensical. Bases develop when stocks that had been trending downward finally stop doing so and begin a largely horizontal or sideways sometimes meandering trend (see Figure 1). The advancing stage is when the stock begins to move, generally after a breakout on a noticeable increase in volume (though not always). The top area is characterized by a dramatic dropoff in momentum, sometimes accompanied by such technical phenomena as negative divergences and nonconfirmations either with other stocks in the same group or with trusted indicators. The declining stage largely speaks for itself, and represents the selling of those who took positions during the earlier stages as well as the behavior of short-sellers whose positions taken during the third
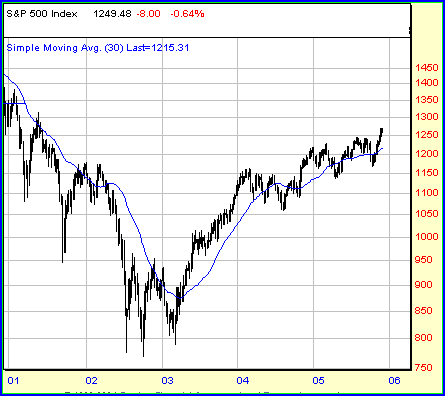
Figure 1: S&P 500, Weekly. A market that has trended sideways and then rises up and above a similarly rising 30-week simple moving average is a market that has likely moved from stage 1 (basing) to stage 2 (advancing).
Easy enough and even easier in retrospect. So what are the tools that speculators can use to determine or confirm which market stage a given stock (or index, for that matter) is in? Weinstein, in Secrets To Profiting, is partial to the 30-week simple moving average (SMA) which works out to about a 150-day SMA. As the examples in his work show, it is movement above this moving average preferably with a pullback afterward that confirms that the moving average resistance has indeed become support that marks the progress of a market from stage 1 (basing) to stage 2 (advancing). Similarly, it is the breakdown below this moving average (in this instance, with a bounce that confirms that the moving average support has become resistance) that encourages him to suspect that a market has moved from stage 3 (topping) to stage 4 (declining). CHANNEL GUIDE
During [stage 1], there will usually be several swings between support at the bottom of the trading range and resistance at the top of the range. This basing action can go on for months or, in some cases, years.
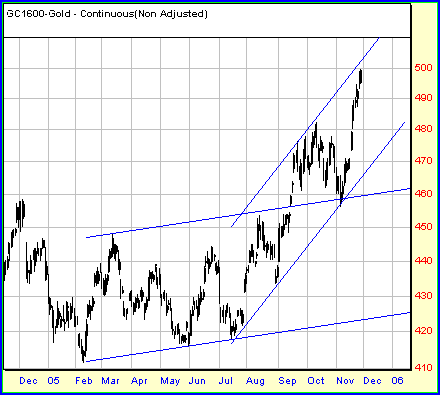
How can a trend channel be used to help speculators avoid making this mistake? First, let's understand what a trend channel is. As Elli Gifford wrote in her book The Investor's Guide To Technical Analysis, "[P]arallel trend channels frequently form, encompassing the vast majority of data points; these [trendlines] identify overextension when the price approaches them." It is this notion of "overextension" that is key, as John J. Murphy in The Visual Investor hints near the end of this passage on trend channels:
Channel lines are easily drawn on price charts and often help identify support and resistance levels. Markets will often trend between two parallel trendlines, one above and one below the price action It is usually a good idea to know where rising channel lines are located, since markets will often stall at that level.
Figure 2: Continuous gold futures, Daily. As gold goes nearly vertical in the autumn of 2005, a new trend channel emerges to encompass its price action. Note the test of the upper boundary of the old trend channel in early November.
As I pointed out in a recent Working Money article, "BOSO," October 5, 2005), speculators who believe that overbought markets (that is, "too high to buy") have limited upside are often confounded when such markets only continue to move higher and higher. The speculator may be right: a given market may be "overbought." But speculators are rewarded for their positions taken during market moves, and speculators who turn up their noses at overbought markets will often find themselves snubbing the potential for profit in the process. What does this have to do with trend channels and stage analysis? As a market moves from its stage 1, basing stage, to its stage 2, advancing stage, that market will likely break free from an initial trend channel, becoming at least temporarily "overbought" or "overextended." This, in fact, is among the first clues that a market is moving from the basing stage to the advancing stage, and often occurs even before the surge in volume that many traders look for to spot the transition from, essentially, base to bull market.
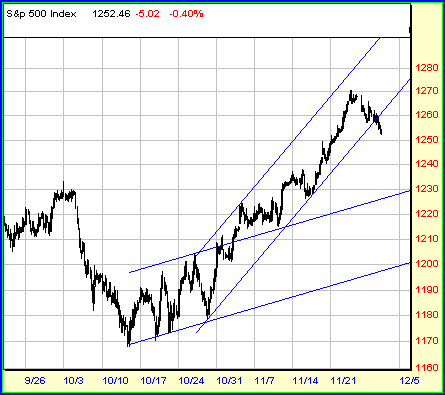
THE ACTION OF AUTUMN Note the market in mid-October in the hourly Standard & Poor's 500 chart in Figure 3. Going into midmonth, the S&P 500 had been in a downtrend since August 2005. That decline led predictably in some ways into the traditional October lows. Between October 10 and the end of the month, the S&P 500 consolidated in a wide and loose pattern between 1200 and 1170. Even though this consolidation has an upward bias as evidenced by both the pattern of higher highs and higher lows shown on the hourly chart, as well as the upwardly cast trend channel this stage 1 behavior is the sort of thing that traders on balance would be wise to avoid.
Figure 3: S&P 500, Hourly. The upwardly biased market moves in stage 1 give away to a far more heart-friendly stage two rally at the beginning of November.
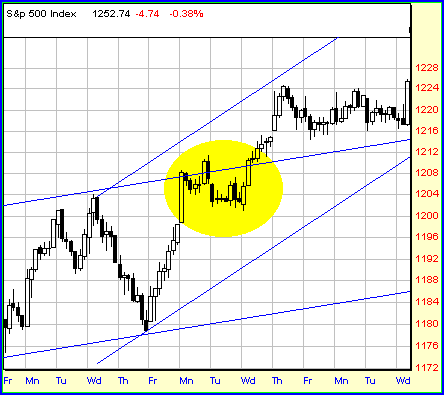
All those swings up and down have both financial and psychological consequences. Managing risk is about more than just limiting financial losses which would have been difficult enough, given the 20- to 30-point swings in the S&P 500 in the second half of October. Managing risk is also about insulating oneself against (or avoiding altogether) the sort of emotional ups and downs that stage 1 markets can bring. Although personifying a market into a singular entity is a dicey business, it is not for nothing that speculators refer to such market swings as "trying to shake the weak hands loose." In this case, it is clear that the market was "trying" to shake weak-willed bulls out of their positions and to give just the tiniest bit of hope to greedy bears. But rather than play the market's game, wouldn't it be better to let the market make its gyrations and wait to take a position once the market had made its true intentions plain? These intentions became increasingly apparent at the end of October as the S&P 500 broke out above the initial trend channel. True, the market shortly slipped back below the upper boundary of the trend channel. But the reentry was especially shallow, not even retracing 38.2% of the rally from the near low (October 27 at 1178.90).
Figure 4: S&P 500, Hourly. A closeup of the breakout, pullback, and subsequent successful breakout from the trend channel that began with the mid-October lows.
The second effort to break out, however, was a smashing success, as prices moved smartly throughout the second day of November and virtually soared on the third. Clear as this development was on the hourly chart, on the daily chart, the breakout from the trend channel was all the more convincing. It would be a few days before speculators could cast the new trend channel. Often, the stage 2 trend channel cannot be drawn until the market makes its first serious test of the previous channel's upper boundary to see if it has become a true level of support. The low from this test tends to serve as the pivot to which a new support trendline and thus a new trend channel can be drawn. I should add that the test of resistance need not be absolute. Prices can and sometimes do slip back into the old trend channel. What is important in such instances is that traders use other tools Fibonacci retracement levels, previous support levels from old highs, and/or candlestick patterns to gauge whether the retreat back into the trend channel is sufficiently mild as not to invalidate the essential support provided by the upper boundary of the old trend channel. No such caveats were necessary in this instance. On the morning of November 10 after a few days of post-breakout, sideways trading, the S&P 500 dipped to within a few points of the upper boundary of the old trend channel, only to rocket away from that boundary as the trading day drew to a close. From the point of view of testing a former upper boundary as an area of new support, it is hard to conceive of a more successful test. CHANGING CHANNELS
A channel line marks the area of bulls' maximum power in an uptrend and bears' maximum power in a downtrend. The wider the channel, the stronger the trend. It pays to trade in the direction of the channel's slope, going long in the lower quarter or half of a rising channel and selling short in the upper quarter or half of a falling channel. Profits should be taken at the opposite channel wall.
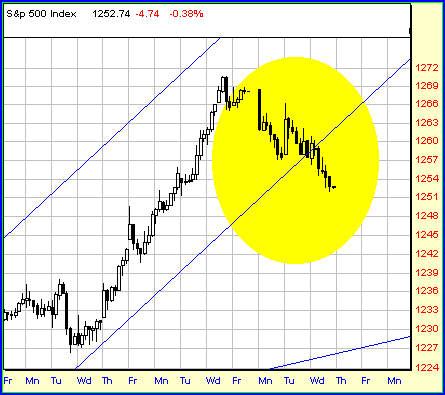
These trading strategies alone tip us off to how trend channels can help speculators figure out when a market might be moving from stage 3 (topping) to stage 4 (declining). If we imagine a speculator selling short (or taking profits) at the upper boundary of a trend channel and going long (or covering shorts) at the lower boundary, then the moment that one of those trades becomes a loss is the moment when something has happened to the trend. In the first instance of selling at the upper boundary, a losing trade means that the market could be headed significantly higher. It is even likely that a new trend channel is about to emerge one at an even sharper angle of ascent than before. However frustrating such a loss might be, our speculator would at least take solace in the fact that the uptrend has been validated. However, if our speculator attempted to buy at the lower boundary of a trend channel and ended up in a losing position, it could only mean one thing: the market had lost the support of the lower boundary and slipped free from the trend channel. Does this mean that the trend has reversed? A "yes" answer would be far too premature. In fact, at this point, it might not even be clear if stage 4 (declining) had appeared. As was the case with the ride up and the move from stage 1 (basing) to stage 2 (advancing), speculators can afford to wait to see if the market will test the lower boundary of the trend channel for resistance (see Figure 5). If there is no resistance, then the market will likely pop back into the trend channel, affording the speculator with another opportunity to go long. If there is resistance, however, then the market should be repelled from the lower boundary and continue moving downward. In that latter case, the transition from stage 3 (topping) to stage 4 (declining) would be at hand.
Figure 5: S&P 500, Hourly. The S&P 500 slipping below the lower boundary of its trend channel is a warning sign that stage 3 (topping) might be transitioning to stage 4 (declining).
Where do markets go after stage 4? In the current case of the S&P 500 in late November/early December 2005, the most obvious source of support is the upper boundary of the old trend channel currently at about 1230. If you'll forgive another personification, markets have long memories, and I've found that it can pay off to keep and extend the lines of old trend channels until they prove themselves irrelevant by subsequent market action. Such a correction, I should add, would represent a nearly perfect 38.2% Fibonacci retracement of the advance from the mid-October low to the late November high, and could function as an excellent place for market participants to once again sort themselves out and plan for the next move higher.
David Penn may be reached at DPenn@Traders.com.
SUGGESTED READING Current and past articles from Working Money, The Investors' Magazine, can be found at Working-Money.com.
|
Technical Writer for Technical Analysis of STOCKS & COMMODITIES magazine, Working-Money.com, and Traders.com Advantage.
| Title: | Traders.com Technical Writer |
| Company: | Technical Analysis, Inc. |
| Address: | 4757 California Avenue SW |
| Seattle, WA 98116 | |
| Phone # for sales: | 206 938 0570 |
| Fax: | 206 938 1307 |
| Website: | www.traders.com |
| E-mail address: | DPenn@traders.com |
Traders' Resource Links | |
| Charting the Stock Market: The Wyckoff Method -- Books | |
| Working-Money.com -- Online Trading Services | |
| Traders.com Advantage -- Online Trading Services | |
| Technical Analysis of Stocks & Commodities -- Publications and Newsletters | |
| Working Money, at Working-Money.com -- Publications and Newsletters | |
| Traders.com Advantage -- Publications and Newsletters | |
| Professional Traders Starter Kit -- Software | |
PRINT THIS ARTICLE

Request Information From Our Sponsors
- StockCharts.com, Inc.
- Candle Patterns
- Candlestick Charting Explained
- Intermarket Technical Analysis
- John Murphy on Chart Analysis
- John Murphy's Chart Pattern Recognition
- John Murphy's Market Message
- MurphyExplainsMarketAnalysis-Intermarket Analysis
- MurphyExplainsMarketAnalysis-Visual Analysis
- StockCharts.com
- Technical Analysis of the Financial Markets
- The Visual Investor
- VectorVest, Inc.
- Executive Premier Workshop
- One-Day Options Course
- OptionsPro
- Retirement Income Workshop
- Sure-Fire Trading Systems (VectorVest, Inc.)
- Trading as a Business Workshop
- VectorVest 7 EOD
- VectorVest 7 RealTime/IntraDay
- VectorVest AutoTester
- VectorVest Educational Services
- VectorVest OnLine
- VectorVest Options Analyzer
- VectorVest ProGraphics v6.0
- VectorVest ProTrader 7
- VectorVest RealTime Derby Tool
- VectorVest Simulator
- VectorVest Variator
- VectorVest Watchdog

