HOT TOPICS LIST
- Strategies
- Stocks
- Buy
- Investing
- Brokers
- Psychology
- Interviews
- Accumulate
- Sell
- Hold
- Spotlight
- Websites
- Candlestick Corner
- Gold & Metals
- Options Trading
LIST OF TOPICS
THE CHARTIST
Pivot Points, Stop Losses, & Buy-Stops
02/10/06 11:02:04 AM PSTby Rudy Teseo
They go together like mini-wheats, milk, and bananas.
| What a market does when crossing pivot points is a good judge of the overall market trend. Prices crossing above the central pivot indicate a bullish trend and vice versa for prices crossing below the pivot point. What is a pivot point? The definition depends on whom you're asking. There are pivot points that are derived from a formula involving the high, low, and close of today's prices. Some analysts define pivot points as the turning points at peaks and troughs. Investor's Business Daily refers to pivot points as the tick above the center spike of a double bottom, or the tick above the high of the handle in a cup with handle. The first of these is objective: there's no confusion as to the result of a formula. The next two may be subjective: there could be argument as to the exact price of the pivot point, especially since pivot points change minute by minute. IDENTIFYING PIVOTS
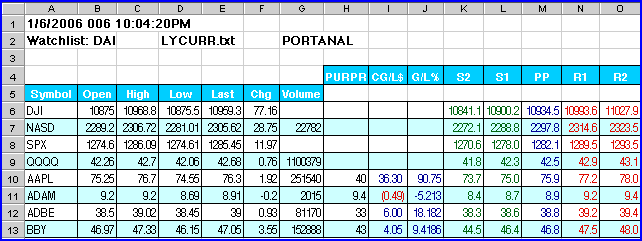
Figure 1 is a portion of my portfolio analysis (PortAnal) spreadsheet showing the values of these points alongside each security. Note the position of PP midway between S2 and R2. You can see why PP is sometimes referred to as the fulcrum. We see from our charts that Apple Computer (AAPL) has been in a steady upswing. One of Value Line's rules is to buy when a stock hits a new high. But it's a bit pricey here, so what's a good entry strategy?
Figure 1: Spreadsheet showing pivot point values for each security (PPSS.XLS).
Well, with support and resistance levels defined, this is as good a picture of tomorrow's probable boundaries as you will find. If the price at the opening is above the PP, indicating an upward continuation, you could enter long at the market. However, some hedging might be desired. You could place a stop-loss at S2 1. This would protect against the stock breaking through the second support line, and still give a one-dollar cushion in case it hits but bounces off the support line. If you're willing to give up a few points on the buy side for a little assurance, you could place a buy-stop at R2+1. The reasoning is that if it breaks through resistance, it'll keep going. Again, the one-dollar cushion guards against buying if the price hits R2 and bounces back. The one-dollar cushion wouldn't apply to all stock prices, and should probably be adjusted accordingly. PIVOTS ON YOUR SPREADSHEET
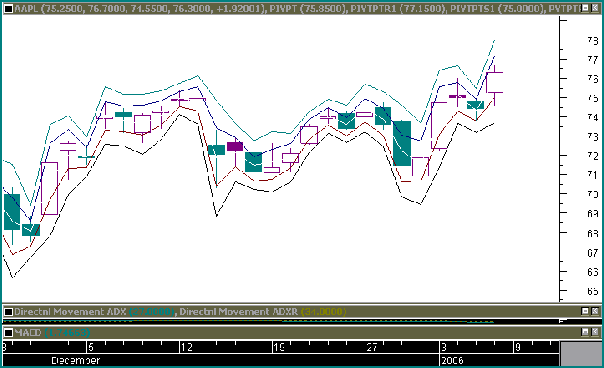
If you would like to duplicate this spreadsheet, you will have to have a data source that includes the high, low, and close. The open does not enter into the equation. Note that you cannot use this for mutual funds, as most funds only report end-of-day closing prices. If you change any of the first 10 columns, you will have to change the cell references accordingly. However, if you construct the spreadsheet as shown and then make your changes, the cell references will change automatically. Figure 2 shows these values used to plot custom indicators. The PP was omitted to reduce the confusion. Here you see the support and resistance points very clearly. This pattern gives you a picture of the four values rather than a tabular one.
Figure 2: Chart of AAPL with pivot points plotted as custom indicators.
Here are the plots in MetaStock. This may help you in plotting custom indicators in your charting program. In MetaStock, PP was made a function, and thereafter it was pasted into the plot logic, which saved a lot of typing and avoided possible typos:
One problem you might have accepting these values is that S2 may be too tight for your investment style. If you have been using a standard 7% stop-loss, some R2s may only be 3-4% below PP even with the added dollar. If you do a little tweaking, you can make the percentage any value you want. I have found that doubling the value of H and L in the formula for S2 changed a 3% difference to 5%. You can have fun with this. If you've come this far, perhaps you'll go one step further. There are alternates to the formulas that give different results. One variation is to add the opening to the PP formula and then divide by 4. Another is to substitute yesterday's close with today's open. Then there's the addition of a third support and resistance where S3 = S2 H + L and R3 = R2 + H L. A suggestion: This might be worth adding if you'd like a wider range between PP and support for your stop-loss. Be aware, however, that these ranges are not fixed. With a wide-ranging day between the high and the low, you could find the percentage difference between PP and R3 to be 20-30%. If you haven't been using pivot points, perhaps you're not aware that floor traders and daytraders use pivot points to keep abreast of changes in support and resistance levels. If it's good enough for professionals, why not give it a try? It will give you a new way to look at your charts. BY ANY OTHER NAME
Rudy Teseo is a private equity, options, and currency trader, and has taught classes in option trading and stock charting. He can be reached at rftess@juno.com. SUGGESTED READING Current and past articles from Working Money, The Investors' Magazine, can be found at Working-Money.com.
|
Rudy Teseo is a private investor who trades stocks, options, and currencies. He has taught classes in technical analysis and option trading. He may be reached at rftess@optonline.net.
| E-mail address: | rftess@optonline.net |
PRINT THIS ARTICLE

Request Information From Our Sponsors
- StockCharts.com, Inc.
- Candle Patterns
- Candlestick Charting Explained
- Intermarket Technical Analysis
- John Murphy on Chart Analysis
- John Murphy's Chart Pattern Recognition
- John Murphy's Market Message
- MurphyExplainsMarketAnalysis-Intermarket Analysis
- MurphyExplainsMarketAnalysis-Visual Analysis
- StockCharts.com
- Technical Analysis of the Financial Markets
- The Visual Investor
- VectorVest, Inc.
- Executive Premier Workshop
- One-Day Options Course
- OptionsPro
- Retirement Income Workshop
- Sure-Fire Trading Systems (VectorVest, Inc.)
- Trading as a Business Workshop
- VectorVest 7 EOD
- VectorVest 7 RealTime/IntraDay
- VectorVest AutoTester
- VectorVest Educational Services
- VectorVest OnLine
- VectorVest Options Analyzer
- VectorVest ProGraphics v6.0
- VectorVest ProTrader 7
- VectorVest RealTime Derby Tool
- VectorVest Simulator
- VectorVest Variator
- VectorVest Watchdog


