HOT TOPICS LIST
- Strategies
- Stocks
- Buy
- Investing
- Brokers
- Psychology
- Interviews
- Accumulate
- Sell
- Hold
- Spotlight
- Websites
- Candlestick Corner
- Gold & Metals
- Options Trading
LIST OF TOPICS
THE CHARTIST
Seeking The Uncommon Trade
12/04/12 11:13:00 AM PSTby L.A. Little
Are you looking for just another trade, or an uncommon one?
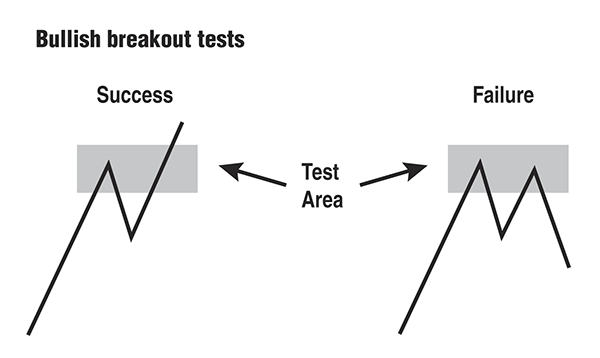
| There’s always another trade, the saying goes, and it’s true. But should you be looking for just another trade? It may be to your advantage to go where others don’t. Instead of looking for just another trade, it’s the uncommon one you should be seeking. The uncommon trade is the diamond in the rough. It’s the trade with greater potential not only from a reward-to-risk perspective, but from a probability of success. That these trades are uncommon is what makes them so sought after, but how can you find them? TRADES COME IN TWO FLAVORS It sounds simplistic and it was intended that way, because in my opinion far too many traders and commentators make it overly complex. Here are a couple of simple charts for visualization. In Figure 1 you see an example of a bullish breakout. In such a case, price pushes up to a prior resistance area and then jumps above it, breaking higher. A breakout trade implies that the trader buys once a breakout occurs. Although Figure 1 depicts a bullish breakout, bearish breakouts are essentially the same pattern — in reverse. Whether prior resistance is defined as a swing point, a resistance line, or any other technical area, the point is that price first reaches then exceeds the levels where resistance resides. |
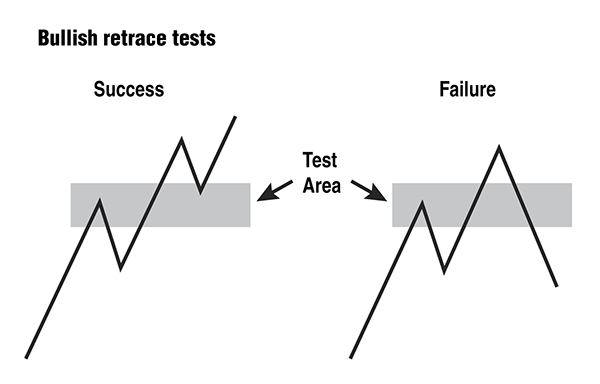
 FIGURE 1: BULLISH BREAKOUT TEST. Here you see an example of a bullish breakout. Prices push up to a prior resistance area and then jumps above it, breaking higher. Figure 2 is an example of a retracement, which is preceded by a breakout; otherwise, there would be nothing to retrace. A successful retracement sees prices approach the prior breakout area, hold, and then reverse to head back the other way. Like breakouts, retracements apply to both bullish and bearish setups.
FIGURE 2: BULLISH RETRACEMENT TEST. A retracement is preceded by a breakout. A successful retracement sees prices approach the prior breakout area, hold, and then reverse to head back the other way. These two trade setups and variations make up all trade setups. Every trade we have made can be explained by these two basic trade types. It is a useful simplification and, once made, allows you to focus on the question at hand: What makes one breakout or retracement setup better than another? |
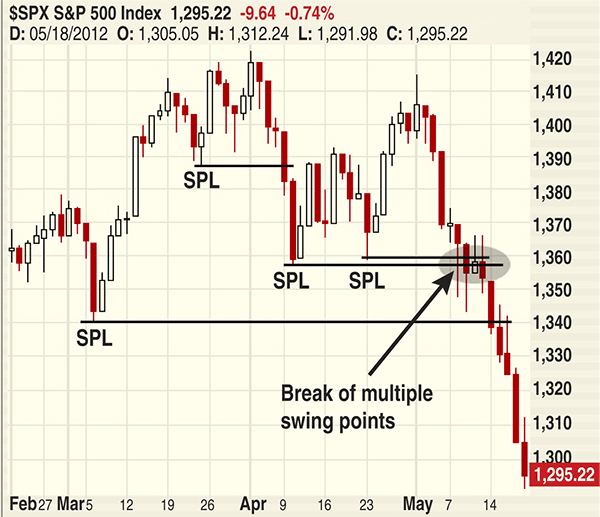
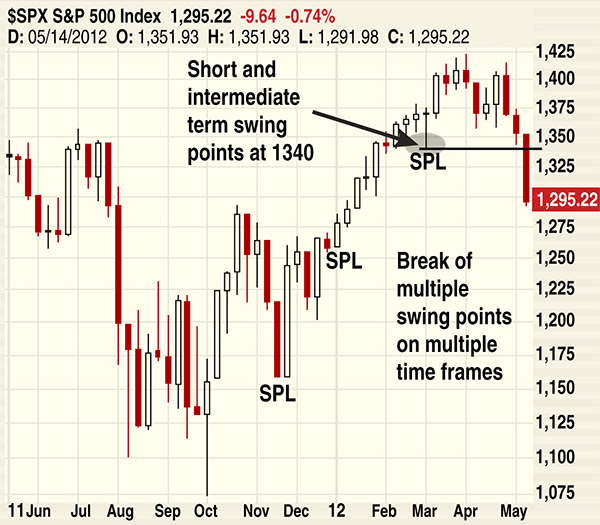
| HIGH-PROBABILITY TRADES Since every trade made involves the future, the best you can have is an increased measure of confidence that the trade you are considering will in fact succeed. Success isn’t meant to imply you can buy something and hang on to it for years until it eventually becomes profitable. No, success implies that a trade is entered with defined parameters of one or more entry points and defined exit points both for a win or a loss. It is with this idea in mind that I set about researching what makes some trades high probability, and as part of my extensive research for my latest book, about trend trade setups, I uncovered some common characteristics about this. As simple as it might sound, the high-probability trades are less common than the regular ones. There are fewer of them, and in large part, that is what makes them so special. When these uncommon patterns set up, they become powerful trades with respect to both the probability of trade success and the size of the move that unfolds. So let’s take a look at one such pattern. Figures 3 and 4 are annotated charts of the Standard & Poor’s 500, with Figure 3 a daily chart and Figure 4 a weekly. Each displays roughly the same number of bars and thus provides the basis for analyzing two separate time frames.
FIGURE 3: SPX, DAILY. The swing point lows (SPLs) are price areas that, if violated, could lead to a fast move lower. The SPL on March 6, 2012, doubles as an SPL on the daily and weekly time frame. |
| In Figure 3, SPL stands for “swing point low,” which is algorithmically determined (see my article in the “Suggested reading” at the end of this article). Note the two SPLs that line up at the same price area on April 10 and 23. From a trading perspective, the two like-priced SPLs should be considered not so much as support (which they typically provide) but as a price area that, if violated, can lead to a fast move lower. A close look at Figure 3 exhibits this behavior once the break does occur. The uncommon trade setup isn’t this particular pattern, though, but a distant, and more rare, cousin. The higher-probability trade that usually is accompanied by a nice payoff is the same concept spread across multiple time frames. Taken together, Figures 3 and 4 outline that configuration. In Figure 3, the next lower SPL on March 6, 2012, actually doubles as a SPL on the daily, and the weekly time frame, as seen in Figure 4.
FIGURE 4: SPX, WEEKLY. The break of multiple swing points on multiple time frames, in this case in early March 2012, indicating a strong chance of something special occurring if prices break the swing points. When multiple swing points across multiple time frames line up as the same price point or price area, then you have the possibility of something special occurring if prices break the swing point. These configurations are not common, but when they do appear, they can produce powerful and speedy moves in the direction of the break if they break. SUMMARY |
| Although there are always trades available in the marketplace, only a few are exceptional. The exception is what you should seek. That they are an exception is what makes them exceptional! SUGGESTED READING
|
L.A. Little is an author, professional trader, and money manager who writes for www.tatoday.com.
PRINT THIS ARTICLE

|

Request Information From Our Sponsors
- StockCharts.com, Inc.
- Candle Patterns
- Candlestick Charting Explained
- Intermarket Technical Analysis
- John Murphy on Chart Analysis
- John Murphy's Chart Pattern Recognition
- John Murphy's Market Message
- MurphyExplainsMarketAnalysis-Intermarket Analysis
- MurphyExplainsMarketAnalysis-Visual Analysis
- StockCharts.com
- Technical Analysis of the Financial Markets
- The Visual Investor
- VectorVest, Inc.
- Executive Premier Workshop
- One-Day Options Course
- OptionsPro
- Retirement Income Workshop
- Sure-Fire Trading Systems (VectorVest, Inc.)
- Trading as a Business Workshop
- VectorVest 7 EOD
- VectorVest 7 RealTime/IntraDay
- VectorVest AutoTester
- VectorVest Educational Services
- VectorVest OnLine
- VectorVest Options Analyzer
- VectorVest ProGraphics v6.0
- VectorVest ProTrader 7
- VectorVest RealTime Derby Tool
- VectorVest Simulator
- VectorVest Variator
- VectorVest Watchdog


