HOT TOPICS LIST
- Strategies
- Stocks
- Buy
- Investing
- Brokers
- Psychology
- Interviews
- Accumulate
- Sell
- Hold
- Spotlight
- Websites
- Candlestick Corner
- Gold & Metals
- Options Trading
LIST OF TOPICS
TRADER'S NOTEBOOK
Placing Stops With Moving Averages And Bollinger Bands
03/13/13 12:40:26 PM PSTby Bruce Tintelnot
Taking a stop too early is better than taking a loss. Using these two indicators could help.
| Anyone who's studied stops knows that placing them is more of an art than a science. Stops fall into two categories: physical (hard) stops are stop-loss orders placed on a platform with a broker or on an exchange, and mental (soft) stops are nothing more than the trader pressing the exit button to get out of a losing trade. Technical indicators can help take the guesswork and emotion out of trading by providing a logical, algorithm-based filter for any trading strategy. One indicator is used for placing stops and another, usually a momentum indicator, is used for confirming the movement that would trigger a stop-loss order. We can't cover all of the indicators used for this purpose, but the two discussed can provide some good ideas for using these very useful tools. The indicators described here to confirm the stops are the 10-day simple moving average (SMA)(10), Bollinger Bands, the relative strength index (RSI), and the moving average convergence/divergence (MACD). |
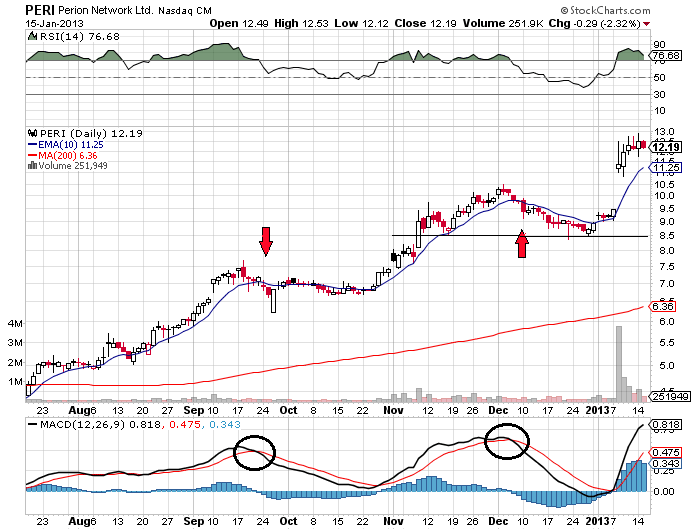
| MOVING AVERAGES Moving averages are the simplest kind of indicator for measuring price trends. Any type of chart can be used with these for placing stops. A 10-period SMA(10) can be used to provide stops that are straightforward and easy to read for smooth-trending markets. When the price breaks out of a support or resistance, stops should be placed below the moving average for uptrends or above the moving average for downtrends. Stops can be placed a number of points under a closing price that breaks below the moving average. The points used for this are completely at the trader's discretion and vary with the volatility of the trend. Trends with low volatility can have tight stops using a lower number of points, and higher volatility would require wider stops with a higher number. Another easy method is to place stops at the closing price when 75% to 100% of a candlestick's real body, or the opening and closing price range, breaks below a moving average. When prices close below the SMA(10) during an uptrend or above it during a downtrend, a stop-loss order can be executed to exit the trade with a nice profit. Whipsaws are a perplexing problem for many traders. These are temporary price fluctuations enough to set off a stop and then return to the level and direction where it started, leaving a trader to place a new order if he wants to continue with the trade toward his target. Increasing the number of periods of the moving average is usually a good safeguard for this. These can be adjusted to the volatility of the chart to a point that most whipsaws come close but don't cross over the MA line. A 30-period moving average is usually adequate for most charts. Figure 1 displays a price movement for Perion Network, Ltd. (PERI), in an uptrend from mid-July 2012 to mid-January 2013. The trend's volatility is low with a consolidation from the middle of September through most of October, and a retracement in December. Stop-loss orders are being triggered when 75% to 100% of a candlestick's real body breaks below the 10-day exponential moving average (EMA)(10).
FIGURE 1: USING MOVING AVERAGES. Here you see price movement for PERI in an uptrend from mid-July 2012 to mid-January 2013. The trend's volatility is low with a consolidation from the middle of September through most of October, and a retracement in December. Stop-loss orders are being triggered when 75% to 100% of a candlestick's real body breaks below the 10-day EMA (10). |
| On September 24, 2012, PERI opened at $6.94 and closed at $6.91 with 100% of the candlestick's real body below the SMA(10). This qualifies as a stop and would have exited the trade with a stop-loss order before a four-week consolidation began to form. This is also confirmed on the MACD and RSI with downward crossovers of the MACD and the histogram, and the RSI line crossing downward out of the overbought area at 70.0. On December 7, 2012, PERI opened at $9.79 and closed at $9.77 with 100% of the candlestick's real body below the SMA(10). This was also confirmed by a downward crossover of the MACD. The RSI was in agreement, entering downward territory between 70.0 and 50.0, eventually crossing below the 50.0 centerline to become a retracement that bounced off support at a previous low. The trend seems to be strong as the price is diverging from the SMA(200). BOLLINGER BANDS Because this indicator forms upper and lower boundaries and follows a moving average, it gives traders some options on where to place stops depending on changing chart conditions. The bands widen when a trend occurs and contract when prices begin to fluctuate and move sideways within a range. In addition, another Bollinger Band using ±1.0 standard deviations (±1SD) from the SMA (20) can be embedded on the original one to form two useful price channels at the upper and lower bands. Instead of trying to use one band to determine when to buy or sell, the price margins display buy and sell areas that offer more flexibility regarding stops. A trader's favorite indicator can be used to confirm which time periods are likely to be used. |
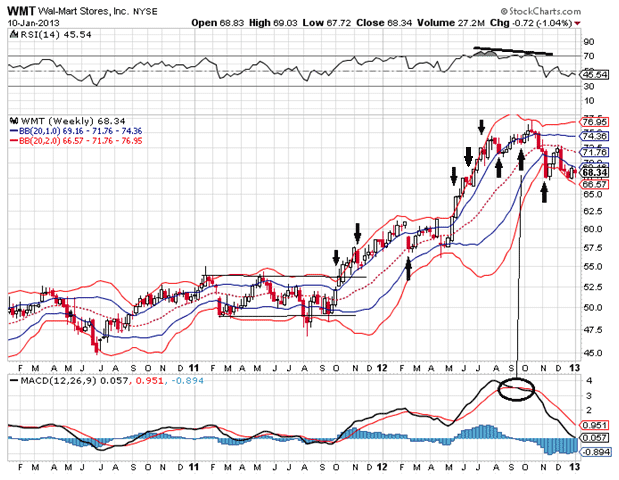
| Figure 2 of Wal-Mart (WMT) shows ±2SD and ±1SD Bollinger Bands interposed on each other, forming the price channels previously mentioned. The black arrows show where trend breakouts are and where the places for stops would likely be. The RSI and MACD are both used for confirmations.
FIGURE 2: USING BOLLINGER BANDS. Here you see ±2SD and ±1SD Bollinger Bands interposed on each other, forming the price channels previously mentioned. The black arrows show where trend breakouts are and where the likely places for stops would be. The RSI and MACD are both used for confirmations. On October 10, 2011, WMT broke out of a rectangle pattern formed within the Bollinger Bands channels and closed above the upper band (+2SD) at $53.79. The MACD averaged and its histogram showed an upward crossover, indicating a possible continuation of the trend. Then on November 14, 2011, the whole body of a candlestick broke below the upper band at $55.51 and could have been considered a stop if a trader was using the single +2SD band, but it was well within the buy zone price margin and the MACD didn't show any indication that the trend was weakening, so it could be ignored. Next, on February 21, 2012, the price gapped below the upper price margin and also below the SMA (20), closing at $57.38. This would be considered a stop for exiting the trade that was confirmed by a crossover in the MACD and its histogram. The volatility of this consolidation continued through May 2012. On May 21, the trend resumed its upward movement as the price closed at $64.60 above the upper band, +2SD. Next, on June 18, price briefly closed below the upper band ±2SD at $66.57 with 100% of the candlestick's real body below the band, but the MACD showed no sign of a weakening trend and the RSI was crossing into the overbought margin. Also on July 16, prices closed downward at $71.47 with over 75% of the range between the opening and closing prices below the upper band. Three indicators -- MACD, its histogram, and the RSI -- showed no signs of a weakening trend. On August 13, price closed below +1SD of the upper margin at $71.59. This would be a likely stop as the indicators began showing signs of trend exhaustion. The space between the MACD averages began narrowing for an eventual crossover and trend reversal, and the histogram reflected this. The RSI broke below the overbought level of 70. |
| In addition, on September 24, the price closed with 100% of the real body of the candlestick, or the range between the opening and closing prices, completely below the +1SD. The MACD and its histogram showed a downward crossover, and the RSI showed a divergence from the upward movement of the chart. Finally, on November 12, 2012, the price closed at $67.66 at the support indicated by a small retracement in June and breaking the 1SD and 2SD. This could be considered for a late stop. Anyone can see that Bollinger Bands in this configuration can provide a plethora of information concerning price movements and points placing stops based on price volatility. Using momentum-based indicators provides good confirmation concerning the validity of a stop in relation to the strength of the prevailing trend. It's wise not to ignore them if traders don't want to find themselves exiting a trade too early while the trend still has plenty of strength left in it. Many traders don't even use stops, relying on their chart savvy to exit trades. This works for some, but many find their orders in trouble more often than they care to admit. Placing stops is a good way to ensure that traders don't find themselves in the unenviable situation of a trade going against them and staying in too long. Putting off an exit with the hope that a price will reverse, only to find that it doesn't, means making an untimely exit and possibly taking a large loss. Stops should be used as a precautionary measure for every trade order, whether they are mental or physical, as they take the emotional factor out of it. Even exiting a trade a little too early for a profit is better than taking a loss. Observing this can save traders, especially novices, a lot of frustration and cash. SUGGESTED READING
|
Bruce Tintelnot is a private trader and freelance writer.
PRINT THIS ARTICLE

Request Information From Our Sponsors
- StockCharts.com, Inc.
- Candle Patterns
- Candlestick Charting Explained
- Intermarket Technical Analysis
- John Murphy on Chart Analysis
- John Murphy's Chart Pattern Recognition
- John Murphy's Market Message
- MurphyExplainsMarketAnalysis-Intermarket Analysis
- MurphyExplainsMarketAnalysis-Visual Analysis
- StockCharts.com
- Technical Analysis of the Financial Markets
- The Visual Investor
- VectorVest, Inc.
- Executive Premier Workshop
- One-Day Options Course
- OptionsPro
- Retirement Income Workshop
- Sure-Fire Trading Systems (VectorVest, Inc.)
- Trading as a Business Workshop
- VectorVest 7 EOD
- VectorVest 7 RealTime/IntraDay
- VectorVest AutoTester
- VectorVest Educational Services
- VectorVest OnLine
- VectorVest Options Analyzer
- VectorVest ProGraphics v6.0
- VectorVest ProTrader 7
- VectorVest RealTime Derby Tool
- VectorVest Simulator
- VectorVest Variator
- VectorVest Watchdog


