

HOT TOPICS LIST
- Strategies
- Stocks
- Buy
- Investing
- Brokers
- Psychology
- Interviews
- Accumulate
- Sell
- Hold
- Spotlight
- Websites
- Candlestick Corner
- Gold & Metals
- Options Trading
LIST OF TOPICS
TRADER'S NOTEBOOK
Three Fundamental Metrics That Matter
05/29/13 02:28:19 PM PSTby Matt Blackman
A trader's job is to find the best indicators for entering and exiting trades. Here are three fundamental metrics that you can't afford to ignore.
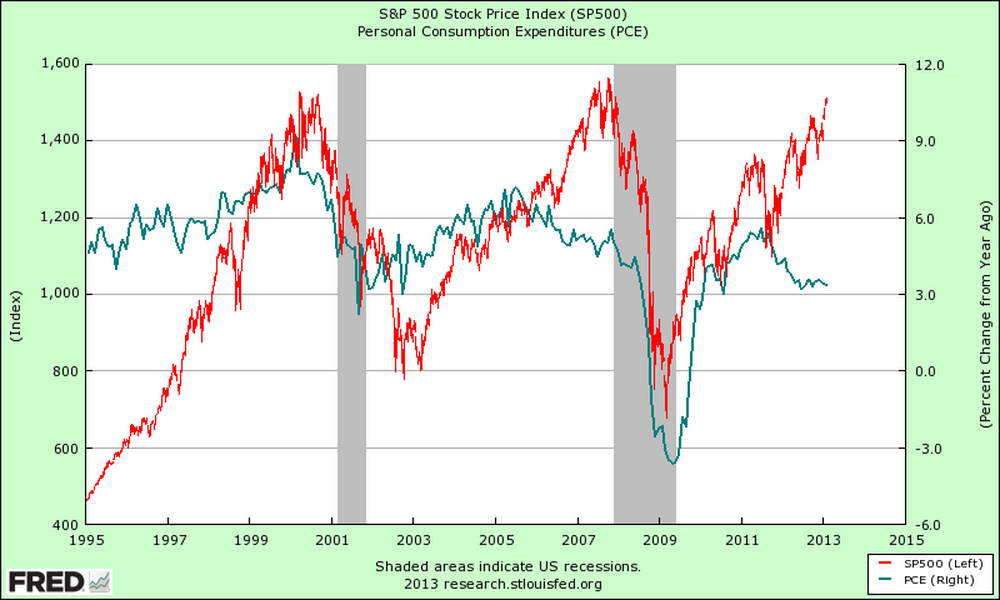
| Unfortunately, many technical traders come to the conclusion early in their careers that fundamentals aren't all that important to their success. They cite that fundamentals lag stock price action. Let's face it: By the time factors such as revenues and earnings are released in quarterly financial statements, the data are three months old and usually already reflected in the price. But what if there were fundamental indicators that led price? TRACKING THE CONSUMER Personal consumption expenditures (PCE) measure the cost of consumer goods and services used by individuals on a daily basis. It's a metric employed by government statisticians to help measure inflation. As you can see in Figure 1, when you compare the PCE percent change from a year ago to the S&P 500 index, there is a correlation between the two. PCE peaked around mid-1999 nearly a year before stocks peaked and bottomed in late 2001, more than a year before stocks. PCE peaked again in early 2006, well ahead of the peak in stocks in October 2007. And the latest PCE peak occurred in 2011, after which it dropped significantly while stocks continued to rise.
FIGURE 1: S&P 500 INDEX VS. PERSONAL CONSUMPTION EXPENDITURES (PCE). There is a clear relationship between the S&P 500 and the PCE. In mid-1999, PCE peaked, which is nearly a year before stocks peaked. PCE bottomed in late 2001, more than a year before stocks. PCE peaked again in early 2006, well ahead of the peak in stocks in October 2007. The latest PCE peak occurred in 2011, after which it dropped significantly while stocks continued to rise. |
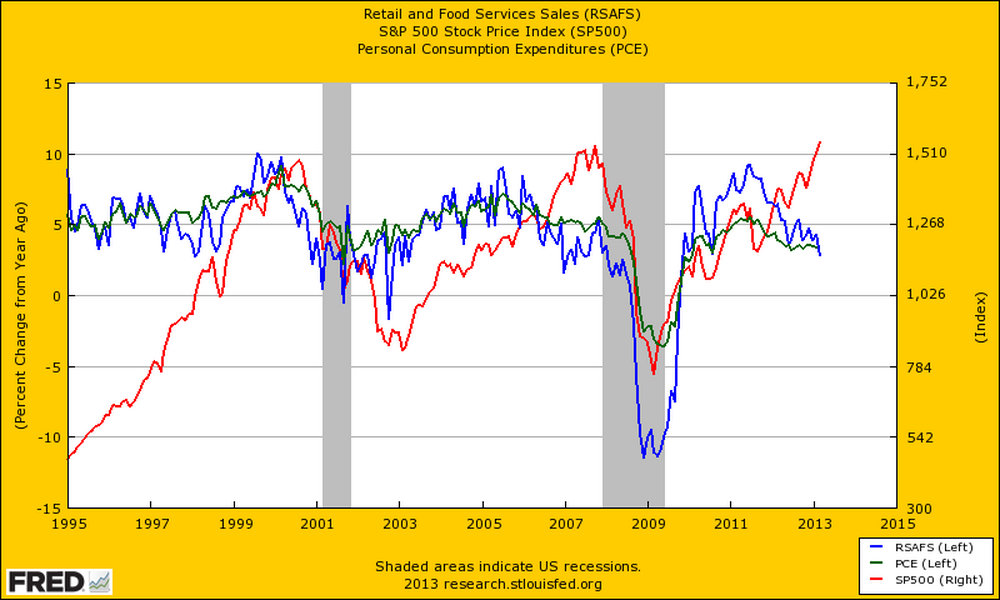
| Another valuable consumption metric is Retail And Food Services Sales (RSAFS), which, like PCE, is available from the St. Louis Federal Reserve website. As we see from Figure 2, RSAFS has a habit of peaking and bottoming just before PCE. Together, they provide an excellent picture of consumer strength, which has exhibited a tendency to lead stocks.
FIGURE 2: S&P 500 (RED), PCE (GREEN), AND RSAFS (BLUE). RSAFS has a habit of peaking and bottoming just before PCE. Together, they provide an excellent picture of consumer strength, which has exhibited a tendency to lead stocks. As Figure 3 shows, retail sales peaked in August 1999, one year before stocks. In January 2006, they peaked again, but this time it was 19 months before the stock market followed suit. Although the last RSAFS peak on the chart was in July 2011, stocks were still heading higher 21 months later in mid-April 2013.
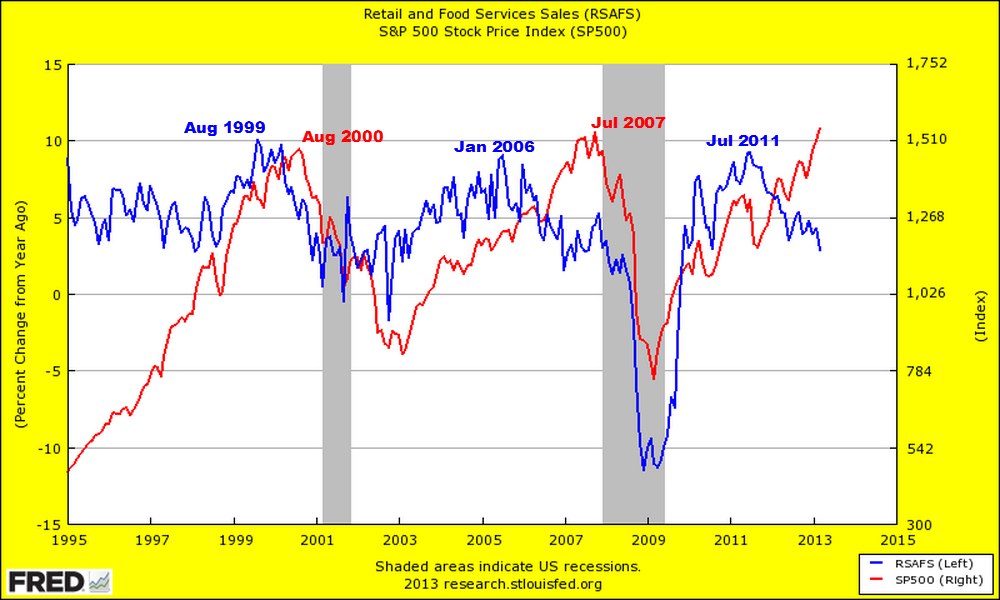
FIGURE 3: S&P 500 WITH RETAIL VS. FOOD SERVICES SALES. Retail sales peaked in August 1999, one year before stocks. In January 2006 they peaked again, but this time, it was 19 months before the stock market followed suit. Although the last RSAFS peak on the chart was in July 2011, stocks were still heading higher 21 months later in mid-April 2013. The lag between peaks has increased, but has the relationship broken down altogether or is it just a matter of time before stocks follow retails sales down? And if the relationship is still intact, when will that be? To help answer those questions, we must examine an important factor that has been impacting markets since 2008. |
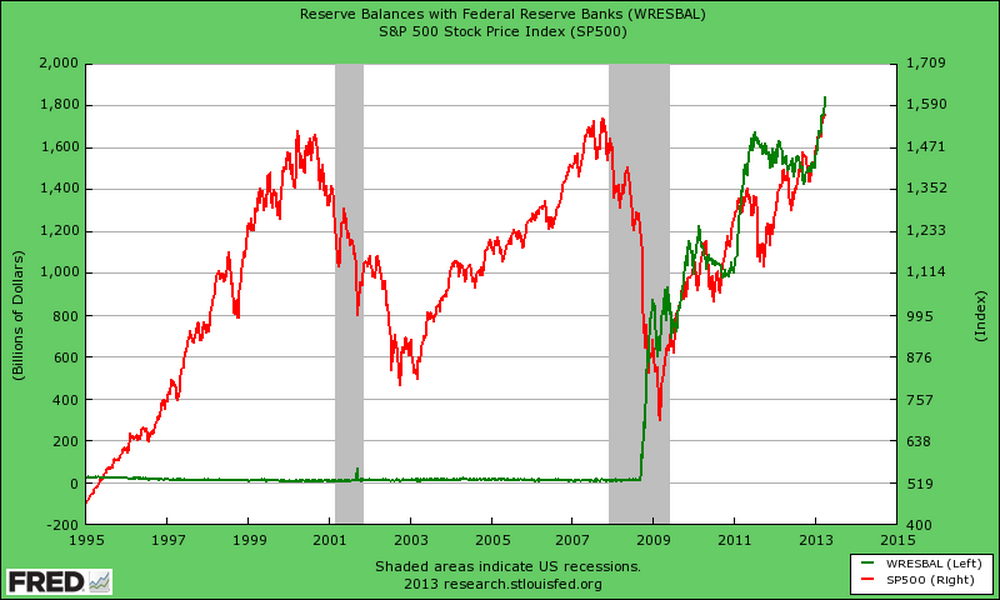
| THE STOCK MARKET SUGARDADDY In November 2008, the world was introduced to a new concept in managing economies. It was euphemistically called quantitative easing (QE), which may sound better than "printing money," but that is basically the end result -- the central bank rapidly expands the money in circulation. If the intention of various QE programs was to return the economy and unemployment figures to more robust levels, it's been a failure. But the same can't be said for stocks. The Federal Reserve's first big stimulus infusion came on September 17, 2008, when its balance sheet jumped more than 400% from the previous week, according to data from the St. Louis Federal Reserve website (http://research.stlouisfed.org). By the end of December that year, in the wake of the collapses of Bear Stearns and Lehman Brothers, the Fed balance sheet had grown by nearly 15,000%, thanks to QE1! Compared to 2008, the following year was relatively quiet and by December 2009, the balance sheet had "only" expanded by another 25%. In March 2010, QE1 ended and the balance sheet actually dropped nearly 4%. But this decline would prove ephemeral -- Chairman Ben Bernanke hinted about QE2 at Jackson Hole in August, and in November, it was formally announced. Next came the pre-election year, when governments have habitually stimulated the economy to begin putting voters in a good mood for the upcoming presidential election. By year-end 2011, the balance sheet had ballooned another 50%. In 2012, the Fed stopped aggressively and openly expanding their balance sheet and in June announced a new strategy of buying and selling Treasuries in a program named "Operation Twist" to help keep the lid on interest rates. In theory, the move was to be revenue neutral. As we see from Figure 4, the correlation between stocks and the Fed balance sheet prior to 2008 wasn't obvious. That changed in dramatic fashion with the huge injection of trillions of dollars in stimulus beginning in November 2008, which completely reenergized stocks.
FIGURE 4. CORRELATION BETWEEN FEDERAL RESERVE BALANCE SHEET (GREEN) AND STOCKS (RED). Prior to 2008, the correlation wasn't obvious. That changed with the huge injection of trillions of dollars in stimulus beginning in November 2008, which completely reenergized stocks. |
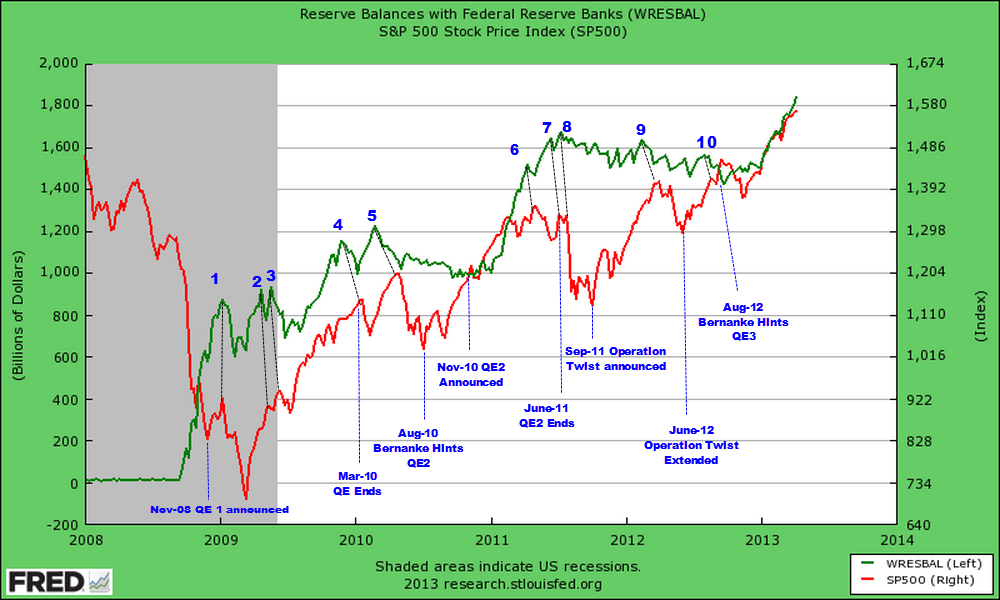
| Next, we take a closer look at the S&P 500 and the Federal Reserve balance sheet after 2007 (Figure 5). It took more than three months after QE was introduced before stocks bottomed. Thereafter, the length of the lags between the two varied. And although stimulus programs financed by the Fed have not been the only factor driving stocks higher -- hints and announcements about various programs also played a part -- they have certainly played a major part.
FIGURE 5. S&P 500 AND THE FEDERAL RESERVE BALANCE SHEET AFTER 2007. From 2008 through 2013, increases and decreases in the Fed balance sheet as well as QE announcements have impacted stocks. So although the correlation between the Fed balance sheet and stocks is not exact, few could argue that stimulus announcements and the size of the Fed balance sheet have not had a dramatic impact on the markets. Here is one final observation. According to Fed data, the Fed balance sheet increased by more than 22% in the first 14 weeks of 2013, which means that at the current rate of expansion, it will have ballooned another 80% by year-end compared to 2012! Operation Twist was supposed to be "balance neutral" -- that is, the Fed sells short-term securities and buys the same amount of long-term securities to keep interest rates low. It was also scheduled to end in December 31, 2012. So what caused the huge jump in the balance sheet starting in early 2013? INTO A MEAN-REVERSION FUTURE |
| But at some point, the government and Federal Reserve will have cheap money programs, and the relationship between the consumer and stock prices will return. The important takeaway is that not only has the traditional relationship between consumption and stocks been impacted in this new QE world, but so has virtually every other indicator that previously worked well at warning of a stock market top! As long as the money flow continues, stocks should continue to prosper. Unfortunately, according to the jaded history of financial exuberance, the longer this bubble takes to build, the bigger the ultimate pop will be when markets eventually head for one ugly mean-reversion toboggan ride. SUGGESTED READING
Charts courtesy of the St. Louis Federal Reserve |
Matt Blackman is a full-time technical and financial writer and trader. He produces corporate and financial newsletters, and assists clients in getting published in the mainstream media. He tweets about stocks he is watching at www.twitter.com/RatioTrade Matt has earned the Chartered Market Technician (CMT) designation.
| E-mail address: | indextradermb@gmail.com |
PRINT THIS ARTICLE

Request Information From Our Sponsors
- StockCharts.com, Inc.
- Candle Patterns
- Candlestick Charting Explained
- Intermarket Technical Analysis
- John Murphy on Chart Analysis
- John Murphy's Chart Pattern Recognition
- John Murphy's Market Message
- MurphyExplainsMarketAnalysis-Intermarket Analysis
- MurphyExplainsMarketAnalysis-Visual Analysis
- StockCharts.com
- Technical Analysis of the Financial Markets
- The Visual Investor
- VectorVest, Inc.
- Executive Premier Workshop
- One-Day Options Course
- OptionsPro
- Retirement Income Workshop
- Sure-Fire Trading Systems (VectorVest, Inc.)
- Trading as a Business Workshop
- VectorVest 7 EOD
- VectorVest 7 RealTime/IntraDay
- VectorVest AutoTester
- VectorVest Educational Services
- VectorVest OnLine
- VectorVest Options Analyzer
- VectorVest ProGraphics v6.0
- VectorVest ProTrader 7
- VectorVest RealTime Derby Tool
- VectorVest Simulator
- VectorVest Variator
- VectorVest Watchdog