

HOT TOPICS LIST
- Strategies
- Stocks
- Buy
- Investing
- Brokers
- Psychology
- Interviews
- Accumulate
- Sell
- Hold
- Spotlight
- Websites
- Candlestick Corner
- Gold & Metals
- Options Trading
LIST OF TOPICS
TRADER'S NOTEBOOK
Is CAT A Reliable Barometer?
03/20/14 08:27:21 AM PSTby Matt Blackman
Here’s one stock that can help you determine the strength of the market.
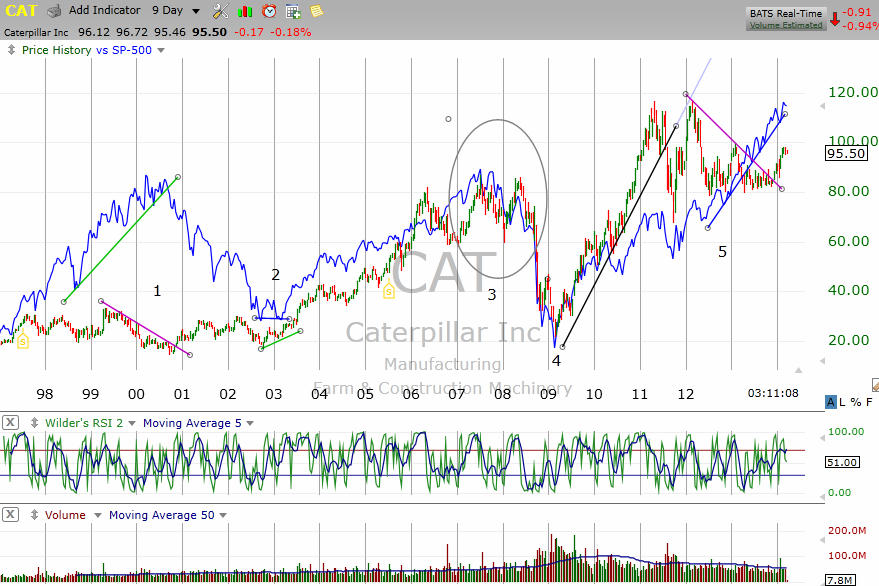
| In his excellent reference Technical Analysis Explained, first published in 1979 and required reading for the Chartered Market Technician (CMT) designation, Martin Pring outlined an indicator called the four-month rule that discussed how the price of General Motors (GM) could be used to gauge overall stock market health. “If in a bull market GM fails to make a new high within four calendar months of its previous peak (although some analysts prefer a 19- to 21-week rule), the bullish trend of the market has reversed or is just about to do so. Similarly, during a market decline, if GM fails to make a new low within four months of its previous trough, a reversal in the downtrend of the market has already taken place or is just about to occur.” Pring ended this discussion by saying that “the GM rule is not infallible, but its record is extremely good.” (See “The Four-Month Rule” at http://premium.working-money.com/wm/display.asp?art=427). Unfortunately, the stock was not so reliable at market bottoms because it often lagged in a recovery, according to Pring. However, this indicator was effectively rendered moot after the fortunes of GM were detrimentally impacted by the financial crisis of 2007-2008, and the company was forced into bankruptcy in 2009. The good news is that another blue-chip bellwether appears to offer a reliable replacement. First introduced in a Traders.com Advantage article titled “Is CAT The New GM Market Proxy?” (see http://technical.traders.com/tradersonline/display.asp?art=7683), the article demonstrated how Caterpillar moved ahead of the S&P 500 at market peaks and troughs. As you see in Figure 1, CAT began to negatively diverge with the SPX in 1997, posting a new short-lived high in May 1999, only to roll over nearly 10 months ahead of the index. CAT then bottomed in November 2000, more than two years ahead of the SPX. Caterpillar then put in a new high in July 2003, which did not occur in the SPX until May 2007. However, CAT bottomed in March 2009 around the same time as the index and so did not provide any real warning that the overall market had turned up until after the fact. CAT then rallied to register another new high in December 2010, 28 months ahead of the SPX.
FIGURE 1: NINE-DAY CHART OF CATERPILLAR, INC. (CAT) AND THE S&P 500 INDEX (BLUE). Here you see that CAT began to negatively diverge with the SPX in 1997, posting a new short-lived high in May 1999 only to roll over nearly 10 months ahead of the index. CAT tended to negatively diverge with the SPX ahead of the peaks in 2000 and 2007. CAT was not so dependable at market bottoms although it tended to move higher ahead of the overall market at the 2003 bottom. |
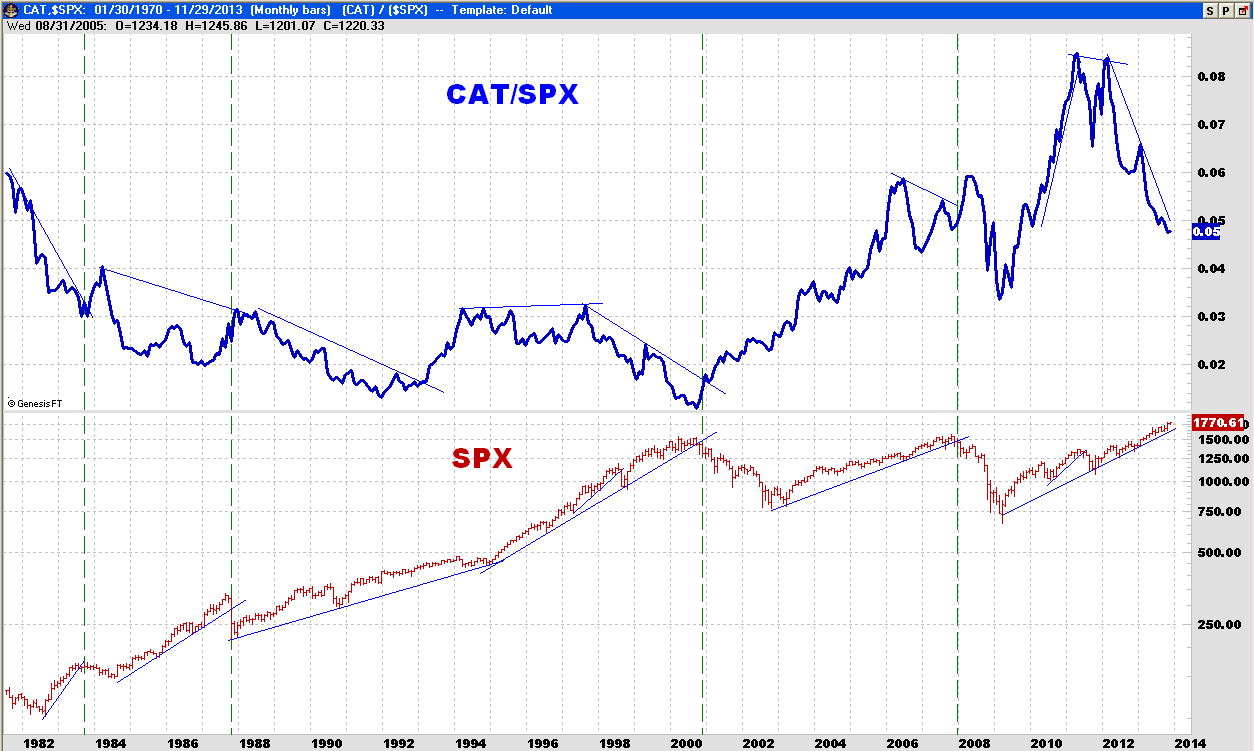
| THE CAT BAROMETER Relative strength (RS) is a concept that has been used by technicians for years. Not to be confused with the relative strength index (RSI) developed by J. Welles Wilder Jr. and introduced in his book New Concepts In Technical Trading Systems, relative strength refers to the relationship of a subject security (plotted in the numerator) to a standard issue (plotted in the demoninator), which is usually an index. By plotting the result, the trader or analyst can quickly see when the subject issue is rising (stronger) or falling (weaker) relative to the standard. In an effort to determine how effective CAT has been at warning of impending strength and weakness in the stock market, I divided CAT by the S&P 500 index and plotted the result on a chart between 1982 and 2013 in Figures 2 and 3.
FIGURE 2: RELATIVE STRENGTH OF CAT RELATIVE TO SPX (BLUE) VS. SPX (RED). Note that there were periods when CAT showed negative and positive relative strength versus the index between 1982 and 2013.
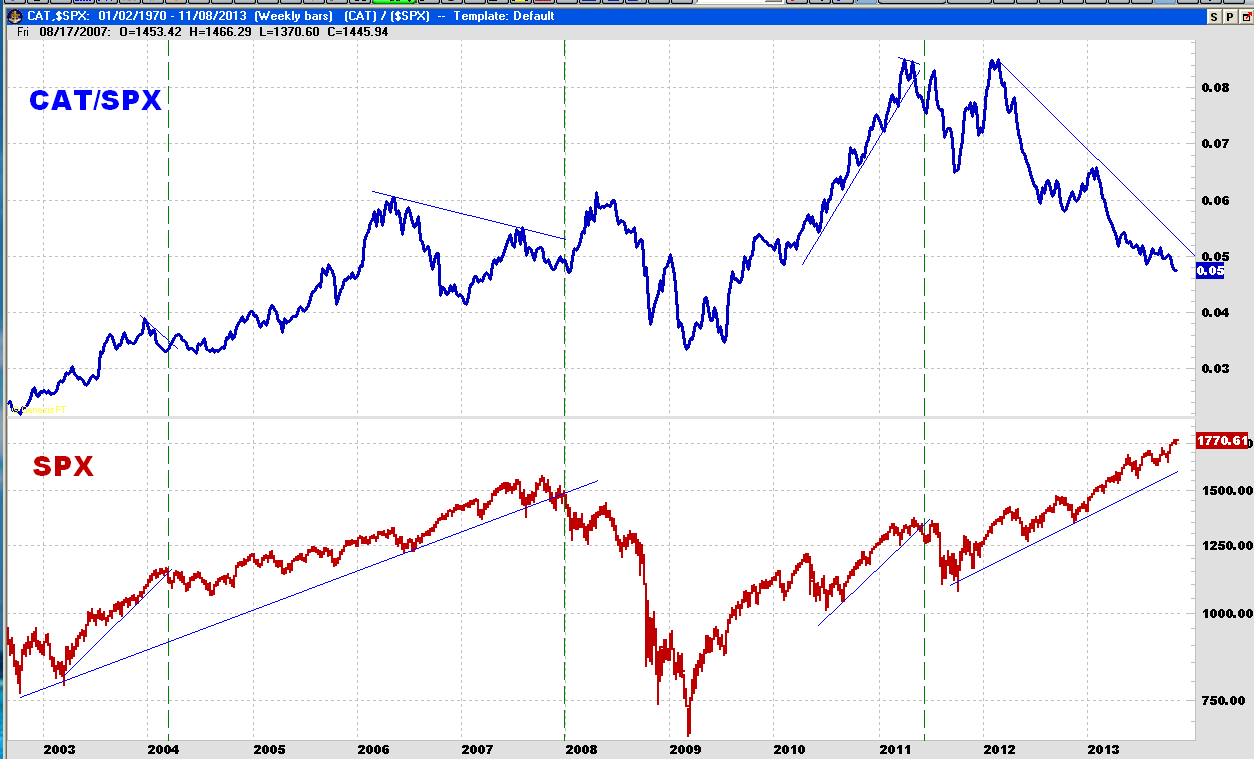
FIGURE 3: CAT/SPX RELATIVE STRENGTH AND SPX. When CAT/SPX is weakening, it is important to draw tight trendlines in your preferred time frame and exit as soon as they are broken. |
| As we see, CAT underperformed the SPX from 1982 until 1991. It began to recover in 1992 before hitting resistance in 1994. CAT then outperformed the SPX in 1996 until August 1997 when the stock peaked and then weakened as the tech bubble took hold and investors dropped traditional companies in favor of anything Internet. But anyone who took serious notice of this negative divergence could have used it as a warning to draw trendlines on the index and exit at the first major break, which came in late 2000. However, the tech meltdown made old-economy stocks like CAT look attractive, causing the stock -- together with housing and construction-related stocks -- to outperform again over the next six years. CAT’s relative strength advantage began to run out of steam in 2006 and the stock peaked in July 2007, three months ahead of the SPX. The relative strength trader using this warning to draw a tight trendline on the SPX would have sold stocks in late 2007, thereby missing most of the carnage in 2008. Even though CAT relative strength diverged positively with the SPX in early 2009, the signal would have been difficult to recognize, since CAT bottomed around the same time as stocks in 2009. But thereafter, CAT exhibited a definite RS advantage until early 2011 when the stock peaked, followed by a second but lower peak after which RS declined and in the process provided the relative strength trader with a warning to tighten the trendline and exit the SPX in May-June 2011. This was followed by another RS peak in February 2012, after which CAT dramatically weakened relative to stocks and which it continued to do. WHY DOES THE CAT BAROMETER WORK?
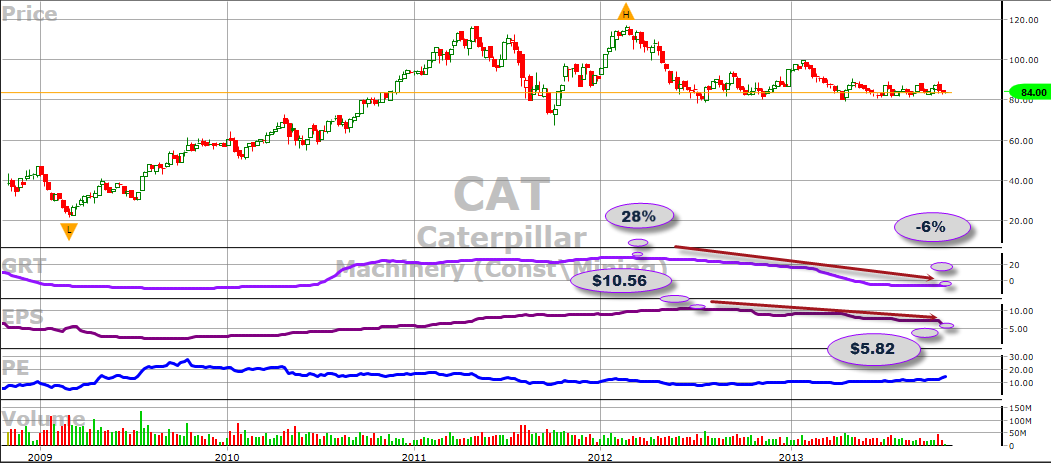
FIGURE 4: WEAKENING FUNDAMENTALS. Here you see the price of CAT hovering around support with the growth rate (GRT), forecasted earnings per share (EPS), and the price/earnings ratio (P/E) reflecting weakening fundamentals in 2012-2013. |
| An argument can be made that Caterpillar is a better proxy for global growth than was General Motors, making it a better indicator. And like GM, it has proven to be a far more reliable leading indicator at market tops than at bottoms. But whatever your view, it is clear that CAT was showing dramatic weakness in 2012 and 2013, providing a warning that the profit-conscious trader would be well advised not to ignore. FURTHER READING
Charts courtesy of TradeNavigator (Figures 1, 2, and 3) and VectorVest (Figure 4) |
Matt Blackman is a full-time technical and financial writer and trader. He produces corporate and financial newsletters, and assists clients in getting published in the mainstream media. He tweets about stocks he is watching at www.twitter.com/RatioTrade Matt has earned the Chartered Market Technician (CMT) designation.
| E-mail address: | indextradermb@gmail.com |
PRINT THIS ARTICLE

Request Information From Our Sponsors
- StockCharts.com, Inc.
- Candle Patterns
- Candlestick Charting Explained
- Intermarket Technical Analysis
- John Murphy on Chart Analysis
- John Murphy's Chart Pattern Recognition
- John Murphy's Market Message
- MurphyExplainsMarketAnalysis-Intermarket Analysis
- MurphyExplainsMarketAnalysis-Visual Analysis
- StockCharts.com
- Technical Analysis of the Financial Markets
- The Visual Investor
- VectorVest, Inc.
- Executive Premier Workshop
- One-Day Options Course
- OptionsPro
- Retirement Income Workshop
- Sure-Fire Trading Systems (VectorVest, Inc.)
- Trading as a Business Workshop
- VectorVest 7 EOD
- VectorVest 7 RealTime/IntraDay
- VectorVest AutoTester
- VectorVest Educational Services
- VectorVest OnLine
- VectorVest Options Analyzer
- VectorVest ProGraphics v6.0
- VectorVest ProTrader 7
- VectorVest RealTime Derby Tool
- VectorVest Simulator
- VectorVest Variator
- VectorVest Watchdog