HOT TOPICS LIST
- Strategies
- Stocks
- Buy
- Investing
- Brokers
- Psychology
- Interviews
- Accumulate
- Sell
- Hold
- Spotlight
- Websites
- Candlestick Corner
- Gold & Metals
- Options Trading
LIST OF TOPICS
TRADER'S NOTEBOOK
Trading The Elliott Wave
06/25/02 02:02:13 PM PSTby Rudy Teseo
Elliott Wave Tutorial: Part IV -- Setting up Elliott wave projections on a spreadsheet can help you make your trading decisions.
| So far we have covered wave theory (part I), wave patterns (part II), and channels (part III). It will be helpful to have those previous articles handy for reference. Finally, we will discuss the detailed procedures for trading the wave. Elliott wave (EW) analysis is probably one of the most flexible systems you will find. You can be 100% bullish and only trade the motive waves in uptrends and the corrective waves in downtrends; you can be 100% bearish and only trade the motive waves in downtrends and the corrective waves in uptrends; or you can be neutral and switch your bull/bear hat and trade every reversal in any trend. The primary goal of any system is to identify market lows suitable for buying (or covering short positions) and market highs suitable for selling (or going short). The EW principle is especially well suited to these functions. No system is perfect, and neither is EW analysis. But it does provide an objective means of assessing the relative possibilities of future paths for the stock or index you are following.
FIBONACCI RETRACEMENTSOnce more, the general rules of Fibonacci retracement from part I are:
Let's review combinations. The highest reliability of price projection is found by calculating all the probabilities based upon all possible retracements and ratios. The object is to arrive at a cluster of numbers, several of which will be so close as to assure the most probable wave end. For example, the W5 projection will produce numbers from the ratios of W1, numbers from the ratios of W2, numbers from the ratios of W3, numbers from the ratios of W4, and numbers from the ratios of the entire length of W1 through W4. With the use of an Excel spreadsheet, this is easier done than said. To project all possibilities from minimum to maximum would require nine columns of Fibonacci ratios: 0.236, 0.382, 0.5, 0.618, 0.786, 1.00, 1.27, 1.618, and 2.618. This would yield a cluster of numbers that would be unmanageable for practical use, so I have simplified my spreadsheet and only use the most typical ratios I have gathered from books, magazine articles, seminars, and websites. Here are the specific retracements and ratios that you will use in your analysis:
Note that as each wave unfolds there are more projections, which lead to larger clusters.
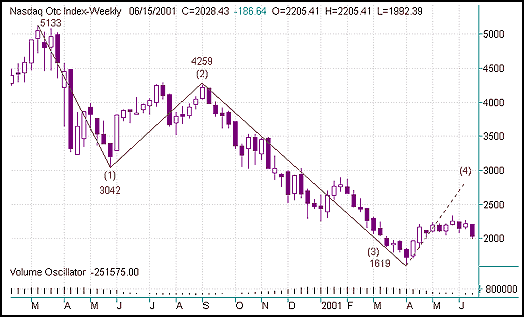
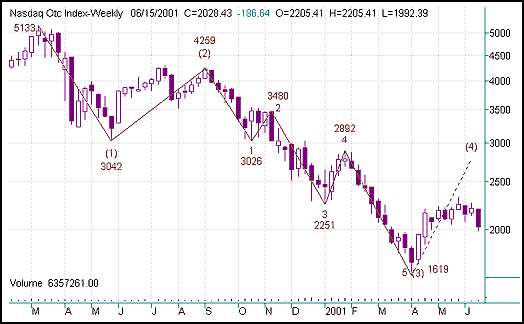
OVERVIEWOnce you have identified wave 1, the start and end prices are entered in the spreadsheet. As these two numbers are entered, projections for the next wave are calculated. The stock chart is then monitored as the pattern unfolds for a reversal to occur somewhere within the projected range. Keep your eyes peeled for bullish and bearish candlestick patterns, as they are good indicators of reversals in the making. (The price should not be expected to move in a straight line from the end of one wave to the end of the next. Lesser-degree waves are always unfolding within the higher-degree waves, both motive and corrective, so there are always zigzags in the price chart.) When the reversal occurs, the actual numbers are entered where appropriate and the next wave's projections are produced. As was shown in part 1 (Figures 1 and 2), there are subwaves within each higher-degree wave. To obtain the best support and resistance levels for your projections, you would have to take the same ratios and retracements of these subwaves as they unfold. To accomplish this down to lower degrees would produce a book instead of an article, and so, we will only be working at the minor level. In Figure 1 you see a display of a weekly chart of the Nasdaq composite showing the completed intermediate waves (1) through (3) from 5133 down to 1619. We are currently in wave (4) (which might be over by the time you read this), as shown by the dotted line. Figure 2 shows the details of the five minor waves making up the intermediate wave (3), from 4259 down to 1619. When the price reversed at 3026, an Elliottician (knowing that wave 2 normally retraces 38.2% of wave 1) would have been looking for wave 2 to reverse at 3497. It actually reversed at 3480, only 36.8%. Did you guess this close? Wave 3 is expected to be 100 to 161.8% of wave 1, so the earliest that wave 3 could be expected to reverse is 2257 (3480-1223). It actually reversed at 2251.
Figure 1: Nasdaq weekly chart, intermediate wave (1)(2)(3) completed
Figure 2: Minor waves of intermediate wave (3)
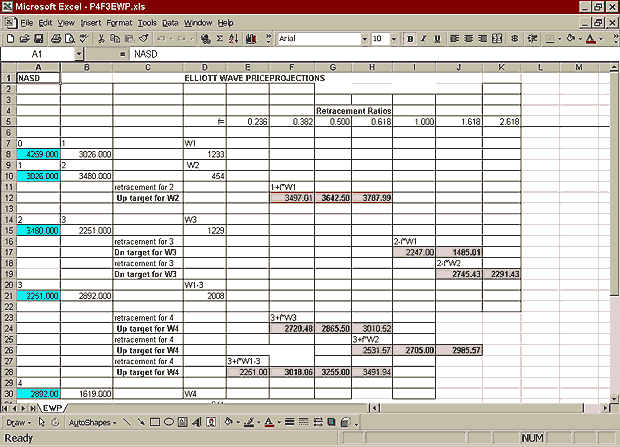
Wave 4 is normally between 38.2 and 61.8% of wave 3. Wave 4 could be expected to reverse anywhere between 2720 and 3010. It reversed at 2892, a 52% retracement of W3. Finally, wave 5 is normally equal to wave 1, which would project the end of wave 5 at 1659. It actually reversed at 1619. Not too shabby! In hindsight, it is obvious that if you had switched your bull/bear hat at each reversal, you would have outperformed the buy-and-hold players. I will use these five minor waves to illustrate the use of my Excel spreadsheet, displayed in Figure 3. This spreadsheet can be downloaded here. Make a master and save it so you can use it repeatedly with different file names. Any of the current popular spreadsheets can be converted to the Excel format. If you don't use a spreadsheet, you can do these calculations with a calculator and set up some form of chart, to record the projected price range you will be looking for.
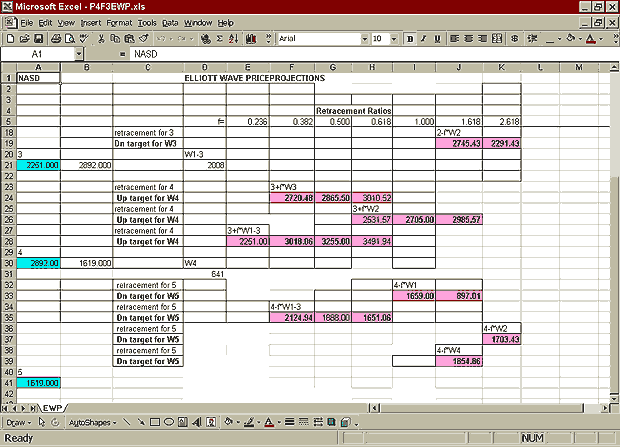
Figure 3: Excel worksheet for Elliott wave calculations
THE PROCEDUREW2: Start by entering the start and end prices of W1 into cells A8 and A10. Projections for W2 appear in cells F12 through H12. The most typical projections are shown in bold. When the reversal occurs, you enter the value in cell A15. In this case, it was 3480, which was not too far out of the cluster for W2.
W3: Entering the value in A15 produces projections for W3 in cells I17 through K19. You monitor the security's price action, expecting a reversal somewhere within this cluster. When the reversal occurs, you enter the value in cell A21. The value of 2251 was within the cluster, although not one of the expected bold figures.
W4: Entering the value in A21 projects price reversals for W4 in cells E28 through J26. Note the increasing number of projections as the wave unfolds. When the reversal occurs, enter the value in cell A30. The price, 2892, was again within the cluster.
W5: Entering the value in A30 projects the end of W5. A wave 5 always simultaneously ends the wave of one degree higher, so this will also end intermediate wave (3). The value of 1619 was slightly more than 100% W1.
On a daily chart, you would note a morning star at the bull reversal of W1, an evening star at the bear reversal of W2, and an outstanding bullish engulfing pattern at W3. Before you begin using the spreadsheet, you want to make some observations to give you an idea of what to expect. Since W3 was a down move, you know that W4 will end up some retracement of W3. According to Elliott wave rules, it must end before 3026, as W4 cannot encroach on W1. The end of W4 up starts W5 down. You will expect W5 to go below W3 by some ratio, so you know that the higher-degree wave will end lower than W3. Remember that W3 cannot be shorter than both W1 and W5, so if W3 is shorter than W1, you can expect W5 to be less than 100% of W1. This spreadsheet is universal in that you can use it in both up and down markets. Since intermediate wave (3) was down, W3 and W5 projections were negative (motive, in the direction of the trend). W2 and W4, being countertrend, were up. These arithmetic calculations are automatically corrected if you use the spreadsheet in an uptrend where the signs would be reversed. To use the spreadsheet in any stock or index projection, make a copy and rename it, then overwrite the numbers as required. You can carry this analysis further to project intermediate waves (4) and (5). Wave (4) cannot encroach on W(1) so it must end before 3042 (see Figure 1). In addition, a W4 often ends at the same price level as W4 of a lesser degree; in this case, 2892 (Figure 1). Remember the guideline of alternation. If W2 is simple, W4 will probably be complex and take much longer to complete. W(2) lasted approximately three months. W(4) has been in the making for almost 10 months at this writing (January 18, 2002). Wave (5) should go below W(3), so we are looking for a new low in the Nasdaq, possibly before year's end. Good luck, and have fun.
Rudy Teseo has taught courses in option trading and the basics of stock charting. Contact him at rftess@juno.com.
All patterns presented courtesy of Prognosis Software Development and its website, www.elwave.com, as well as A.J. Frost and Robert Prechter's Elliott Wave Principle.
SUGGESTED READINGFrost, A.J., and Robert Prechter [1985]. Elliott Wave Principle, New Classics Library.Prognosis Software Development, www.elwave.com, e-mail: info@prognosis.nl. Teseo, Rudy [2002]. "Counting Elliott Waves: Elliott Wave Tutorial, Part I," Working Money: May. _____ [2002]. "Recognizing Elliott Waves: Elliott Wave Tutorial, Part II," Working Money: June. _____ [2002]. "Channeling With Elliott Waves: Elliott Wave Tutorial, Part III," Working Money: June.
Charts: Prognosis Software
Current and past articles from Working Money, The Investors' Magazine, can be found at Working-Money.com. |
Rudy Teseo is a private investor who trades stocks, options, and currencies. He has taught classes in technical analysis and option trading. He may be reached at rftess@optonline.net.
| E-mail address: | rftess@optonline.net |
PRINT THIS ARTICLE

Request Information From Our Sponsors
- StockCharts.com, Inc.
- Candle Patterns
- Candlestick Charting Explained
- Intermarket Technical Analysis
- John Murphy on Chart Analysis
- John Murphy's Chart Pattern Recognition
- John Murphy's Market Message
- MurphyExplainsMarketAnalysis-Intermarket Analysis
- MurphyExplainsMarketAnalysis-Visual Analysis
- StockCharts.com
- Technical Analysis of the Financial Markets
- The Visual Investor
- VectorVest, Inc.
- Executive Premier Workshop
- One-Day Options Course
- OptionsPro
- Retirement Income Workshop
- Sure-Fire Trading Systems (VectorVest, Inc.)
- Trading as a Business Workshop
- VectorVest 7 EOD
- VectorVest 7 RealTime/IntraDay
- VectorVest AutoTester
- VectorVest Educational Services
- VectorVest OnLine
- VectorVest Options Analyzer
- VectorVest ProGraphics v6.0
- VectorVest ProTrader 7
- VectorVest RealTime Derby Tool
- VectorVest Simulator
- VectorVest Variator
- VectorVest Watchdog


