HOT TOPICS LIST
- Strategies
- Stocks
- Buy
- Investing
- Brokers
- Psychology
- Interviews
- Accumulate
- Sell
- Hold
- Spotlight
- Websites
- Candlestick Corner
- Gold & Metals
- Options Trading
LIST OF TOPICS
Les Nonconfirmations Dangereuses?
07/21/04 04:55:41 PM PSTby David Penn
Strength in the transports plus weakness in the industrials equals a summer of listless trading in the markets, no matter what the language.
| A month or so ago, I wrote an article titled "Bearish Confirmations." At the time, the Dow transports had just barely exceeded their May and April highs, while the Dow industrials had managed to best their May highs but remained below April's highest prices. This, I sought to point out, was a nonconfirmation, a Dow theory "nonevent" that suggested that when all was said and done, no trend change could be established and, as such, the prevailing trend had to be considered still in effect. That prevailing trend was bearish. This was true, at least, in a Dow theory sense — the averages having provided a confirmed sell signal back in March 2004 (the simultaneous breaking down below the February 2004 lows — see my chronicle of that event in "Bearish Confirmations," April 14, 2004, Working-Money.com). While this hasn't caused too much discomfort for those whose bearish chips might be working against the industrials — in negative territory since the March 10th sell signal — those bears looking to capitalize on the transports' end of the deal have truly been living in a house of pain.
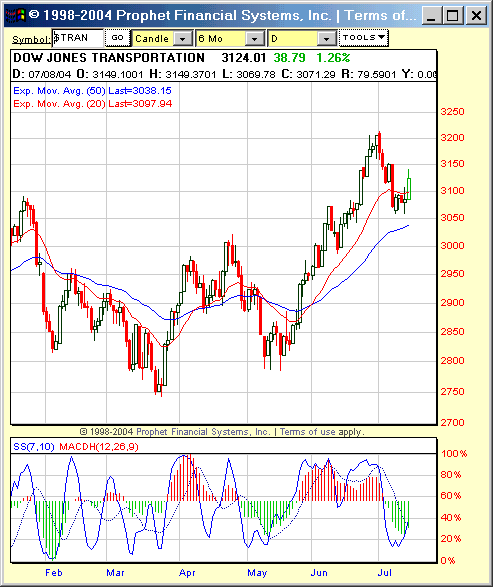
Figure 1: The Dow transports have displayed exceptional strength in the face of rising oil prices and financial troubles in the airlines.
Since the transports' sell signal on March 10, the average has seen a major appreciation. The transports closed at about 2788 on March 10, the day of the Dow theory sell signal. They traded as low as 2743 or so on March 24, and have been in rally mode ever since, with April highs surpassing March highs and June highs surpassing those of April. In fact, the transports ended June near 3200, some 412 points and more than 14% higher than at the time of the March 10th sell signal.
Days of divergenceTo bring us up to speed since "Bearish Confirmations," recall that the next Dow theory-related development was the industrials' inability to rally above the March highs in April. This might have been further confirmation of more downward movement to come in the averages if it hadn't been for the transports, which displayed telling strength in setting a new April high vis-à-vis March. Further complications were introduced when the Dow industrials spent May falling below the March lows. In a perfectly bearish world, the transports would have been expected to do the same — however, echoing their strength from April, the correction that produced a new low in the industrials failed to do so in the transports, as the latter remained convincingly above the lows of March. Let me emphasize a point here. Nonconfirmations such as the one that took place between the transports and the industrials in May are Dow theory nonevents if we hold to the chapter and verse of Dow theory. That does not mean that others using Dow theory as a supplemental or companion analytic approach cannot glean what they want from such "nonevents." In the case of the May 2004 nonconfirmation, such an investor or trader might have reasonably speculated that the behavior in the transports suggested that average might actually move higher — with or without the industrials. If the former proved to be the case, then there was the possibility that the sell signal of March might be replaced by, perhaps, a buy signal in the summer. If the latter proved to be the case, then it seemed unlikely that the averages would produce an additional sell signal in the immediate future. As it appears, the latter option is what the markets have chosen. The rally from the May correction brought both the transports and the industrials up above their May highs. But once again, it was the precorrection-month highs that have proven insurmountable for the industrials, while the transports rallied higher and higher — with an intraday print on July 1 higher than any print during June. The industrials, after a runup early in June, spent the month largely moving sideways.
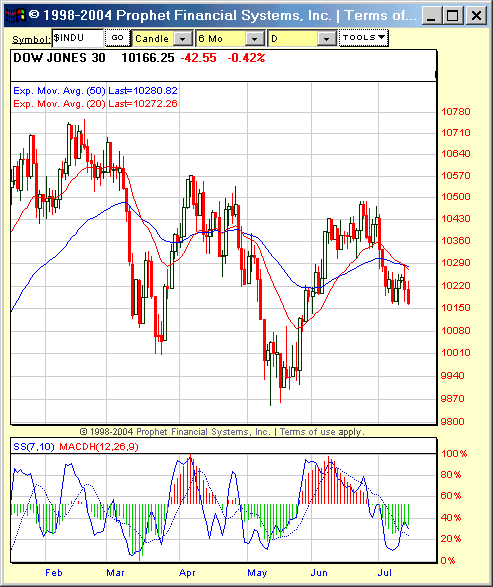
Of looming convergencesBut is it possible that these averages that have been out of sync, out of gear (as STOCKS & COMMODITIES Staff Writer Dennis Peterson likes to say), since the March sell signals are actually starting to get back together again? Both averages entered July 2004 in correction mode — although the transports are pulling back toward support at the 20- and 50-day exponential moving averages while the industrials are bumping up against resistance at their intermediate moving averages. At present, the industrials are finding support at 10150, and should that support hold, the next question will be whether they can rally in July to best their June highs. While there was a higher intraday print in July vis-à-vis June in the transports, most Dow theorists tend to insist that any "tie" goes to the closing price, not the intraday price. Thus, it remains legitimate — from a "pure" Dow theory perspective — to argue that neither the industrials nor the transports have truly set a new July high vis-à-vis June — yet.
Figure 2: Down, perhaps, but far from out, the Dow industrials slip into a trading range in mid-July.
How might such a scenario unfold? Given the current levels in the averages, consider a scenario in which the transports, which had a big upday of more than 1.5% on Thursday, June 15, follow through on that bullishness, yet fail to close above 3205. That would still allow for a 100-point move in the transports, a move that might sufficiently panic weak bears and embolden overconfident bulls. At the same time, if the industrials do in fact find support at 10150, then a rally into a test of the June highs seems like a more than reasonable objective. And of course, if the industrials do rally into such a test, the question of the year (again, in Dow theory terms) will be simple: Will the transports and industrials take out the June 2004 highs? The answer will go a long way toward either reestablishing the March 2004 sell signal or negating it, canceling it out in favor of a new signal — a bullish buy signal — that would relegate both the bearishness of the spring (and the danger of a summer full of confusing nonconfirmations) to the fitting obscurity of the memory hole.
Wherefore transport strength?Although a resolution of the March 2004 Dow theory sell signal is not dependent upon the fate of any individual stock in the transports or industrials, more than a few have wondered about the strength of the transports and what, in a world of oil prices above $35 and taxpayer-funded bailout proposals for the airlines, could be boosting the transportation average while the relatively more diversified industrials continue to languish? I can't answer that question. But I can highlight some of the transportation average stocks that have been outperforming of late. Even if no pattern can be discerned from this cohort of overachievers, spotting them now might go a long way toward identifying real weakness among the leaders when that weakness first begins to show itself.
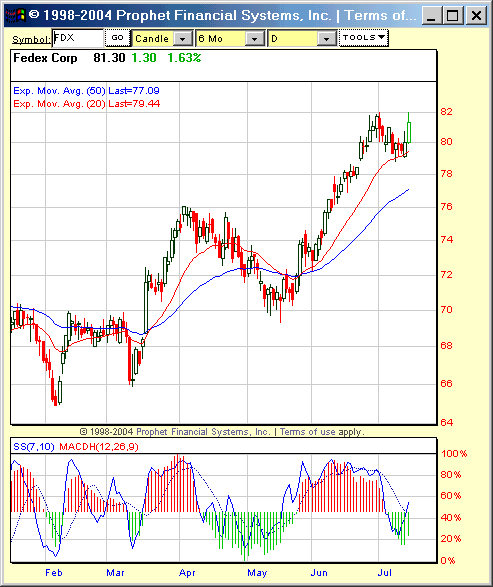
Figure 3: Failures in stocks like UPS and FedEx could anticipate a broader failure in the transports average.
After a cursory scan of the components of the transportation average, it is a good thing we aren't dependent on finding a pattern. Railroad stocks like BNI, trucking stocks like CNF, and shipping companies like FDX are all strong participants in the transports rally since the May lows. In fact, if there is any pattern to be spotted, that pattern might be little more than "airline stocks suck." That said, many of these strong transports stocks like FedEx and CNF, Inc., so mirror the achievement of the transports average that their ability to set new highs in the immediate future should serve as an informal indicator of whether the transports as a whole will be able to respond in kind.
David Penn may be reached at DPenn@Traders.com.
Suggested readingEdwards, Robert D., and John Magee [2001]. Technical Analysis Of Stock Trends, 8th ed., W.H.C. Bassetti, ed. Saint Lucie Press.Penn, David [2004]. "Bearish Confirmations," Working Money: April 14. Peterson, Dennis [2001]. "Volume Speaks Volumes," Working Money: September 28. Charts courtesy Prophet Financial Systems
Current and past articles from Working Money, The Investors' Magazine, can be found at Working-Money.com.
|
Technical Writer for Technical Analysis of STOCKS & COMMODITIES magazine, Working-Money.com, and Traders.com Advantage.
| Title: | Traders.com Technical Writer |
| Company: | Technical Analysis, Inc. |
| Address: | 4757 California Avenue SW |
| Seattle, WA 98116 | |
| Phone # for sales: | 206 938 0570 |
| Fax: | 206 938 1307 |
| Website: | www.traders.com |
| E-mail address: | DPenn@traders.com |
Traders' Resource Links | |
| Charting the Stock Market: The Wyckoff Method -- Books | |
| Working-Money.com -- Online Trading Services | |
| Traders.com Advantage -- Online Trading Services | |
| Technical Analysis of Stocks & Commodities -- Publications and Newsletters | |
| Working Money, at Working-Money.com -- Publications and Newsletters | |
| Traders.com Advantage -- Publications and Newsletters | |
| Professional Traders Starter Kit -- Software | |
PRINT THIS ARTICLE

Request Information From Our Sponsors
- StockCharts.com, Inc.
- Candle Patterns
- Candlestick Charting Explained
- Intermarket Technical Analysis
- John Murphy on Chart Analysis
- John Murphy's Chart Pattern Recognition
- John Murphy's Market Message
- MurphyExplainsMarketAnalysis-Intermarket Analysis
- MurphyExplainsMarketAnalysis-Visual Analysis
- StockCharts.com
- Technical Analysis of the Financial Markets
- The Visual Investor
- VectorVest, Inc.
- Executive Premier Workshop
- One-Day Options Course
- OptionsPro
- Retirement Income Workshop
- Sure-Fire Trading Systems (VectorVest, Inc.)
- Trading as a Business Workshop
- VectorVest 7 EOD
- VectorVest 7 RealTime/IntraDay
- VectorVest AutoTester
- VectorVest Educational Services
- VectorVest OnLine
- VectorVest Options Analyzer
- VectorVest ProGraphics v6.0
- VectorVest ProTrader 7
- VectorVest RealTime Derby Tool
- VectorVest Simulator
- VectorVest Variator
- VectorVest Watchdog


