HOT TOPICS LIST
- Strategies
- Stocks
- Buy
- Investing
- Brokers
- Psychology
- Interviews
- Accumulate
- Sell
- Hold
- Spotlight
- Websites
- Candlestick Corner
- Gold & Metals
- Options Trading
LIST OF TOPICS
CANDLESTICK CORNER
The Morning Star
09/22/04 03:33:19 PM PSTby Stephen W. Bigalow
Here's another candlestick pattern that can help you catch a reversal.
| The major benefit of candlestick signals is that they are easy to learn and identify. There are no formulas to learn. You do not have to do extensive fundamental analysis. Japanese candlesticks are visual tools, and one of the ways they can be used is to identify changes in investor sentiment. Of the 50 or 60 candlestick signals, there are 10 major signals that often occur at reversals. The morning star is one of them.
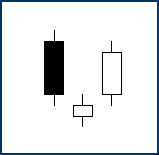
The morning starThe morning star is a clear, symmetrical candlestick reversal pattern (Figure 1). The Japanese rice traders described the planet Mercury as the morning star, mainly because it foretells that brighter things (sunrise) are on the way. In the case of this candlestick pattern, it indicates that prices are going higher. The morning star forms after an obvious downtrend. The first candle of this three-day signal consists of a long black body, usually produced by the fear induced at the bottom of a long decline. The second day's candle (the "star" of the pattern) gaps down, but the magnitude of the trading range remains small for the day, demonstrating indecision. The third day is a white candlestick, which tells us that the bulls have now stepped in and seized control. The optimal morning star signal would have a gap before and after the star (or second) day.
Figure 1: The morning star. This pattern consists of three candlesticks. The first is a long black body; the next one gaps down and has a small trading range. The third candle is a long white one with a close that is higher than the first black candle's midpoint. The makeup of the star itself — the candlestick that demonstrates indecision — can consist of a number of candle formations. However, a doji (which occurs when the open and close are equal) or a spinning top (a candle with a very small body) is usually the predominant formation in a morning star signal. What is important is confirmation that the bulls have taken control the next day. That candle should have a close that is more than halfway up the black candle formed two days ago.
Identifying itFortunately, the morning star signal is visually apparent and relatively easy to spot. Here are some simple parameters that can enhance the morning star signal's probabilities of indicating a reversal:
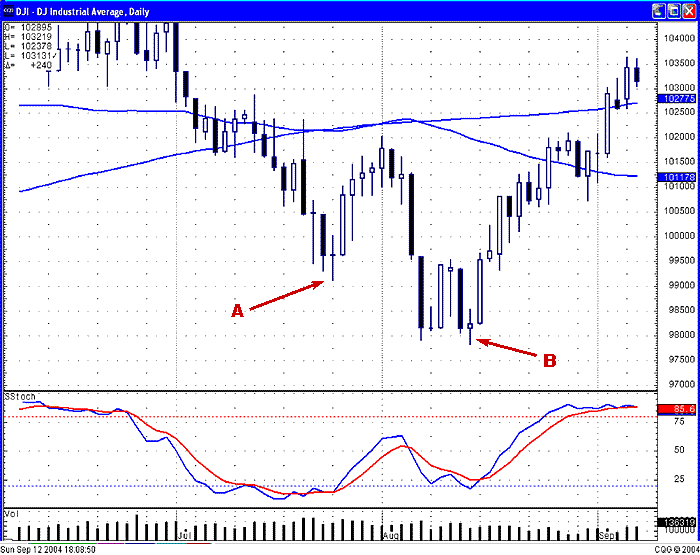
The probability of a morning star signal reversing a trend becomes extremely high when the pattern is found in oversold conditions (as identified by other technical analysis overbought/oversold indicators). The most important element of the signal is the magnitude of the white candle's close during the third day. Candlestick analysis can be used in all trading instruments. Whether you are doing a long-term evaluation on a monthly chart of the Dow Jones Industrial Average (DJIA) or looking at a one-minute chart of the eminis, the signals work just as effectively when it comes to revealing change in investor sentiment during any time frame. As seen in the daily chart of the DJIA in Figure 2, the morning star signals revealed periods when the index establishes a low.
Figure 2: Trend reversal. Here you see morning star formations at both A and B. Note that the stochastic is in oversold territory.
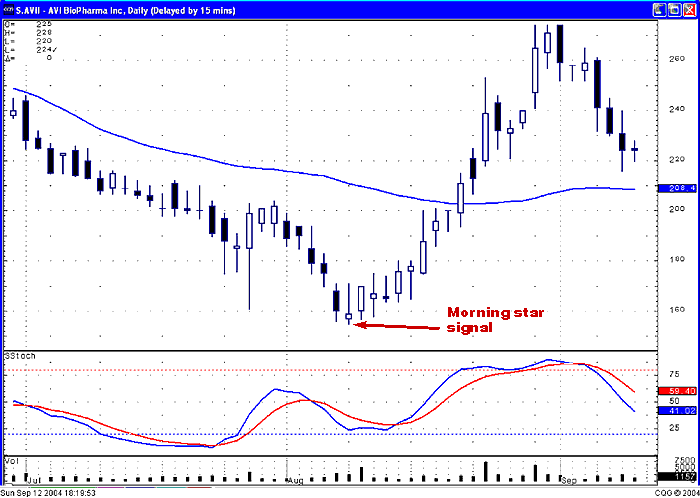
In July and August 2004, the DJIA reversed after morning star signals. Note that at point A, when the stochastic was in an oversold condition, a three-day morning star signal appeared. Then two morning star signals appeared a week later to start the next rally again in the Dow Jones averages. In both cases, these morning star signals correctly acted as buy signals. The ability to identify when the market is moving up allows the candlestick user to establish long positions more aggressively when the market first reverses its trend. For example, on the daily chart of AVI Biopharma Inc. in Figure 3, the morning star pattern appeared at around the same time as it did in the DJIA. If you entered a long position when the morning star signal appeared (as the markets were bottoming), you would have made a large percentage return.
Figure 3: Rising tide. As the market goes, so do individual stocks. The morning star on this chart appeared at around the same time as the morning star in the DJIA.
Fortunately, it is easy to find candlestick signals such as this one, especially with modern scanning software. Not only is it easy, but it can also be done relatively quickly. The morning star is just one example of a reversal signal that can give you successful results, especially when it occurs in oversold conditions.
Stephen W. Bigalow is the author of Profitable Candlestick Trading and principal of www.candlestickforum.com. Through his consulting with major trading firms, Bigalow has developed multiple successful trading programs for both daytraders and long-term investors.
Suggested readingBigalow, Stephen W. [2001]. Profitable Candlestick Trading: Pinpointing Market Opportunities To Maximize Profits, John Wiley & Sons._____ [2004]. "The Harami: A Strong Reversal Signal," Working Money: July 8. _____ [2004]. "Market Timing With Candlesticks," Working Money: February 25. Charts courtesy CQG
Current and past articles from Working Money, The Investors' Magazine, can be found at Working-Money.com.
|
Stephen W. Bigalow is an author and the principal of the www.candlestickforum.com, a website for providing information and educational material about candlestick investing.
| Website: | www.candlestickforum.com |
| E-mail address: | sbigalow@msn.com |
PRINT THIS ARTICLE

|

Request Information From Our Sponsors
- VectorVest, Inc.
- Executive Premier Workshop
- One-Day Options Course
- OptionsPro
- Retirement Income Workshop
- Sure-Fire Trading Systems (VectorVest, Inc.)
- Trading as a Business Workshop
- VectorVest 7 EOD
- VectorVest 7 RealTime/IntraDay
- VectorVest AutoTester
- VectorVest Educational Services
- VectorVest OnLine
- VectorVest Options Analyzer
- VectorVest ProGraphics v6.0
- VectorVest ProTrader 7
- VectorVest RealTime Derby Tool
- VectorVest Simulator
- VectorVest Variator
- VectorVest Watchdog
- StockCharts.com, Inc.
- Candle Patterns
- Candlestick Charting Explained
- Intermarket Technical Analysis
- John Murphy on Chart Analysis
- John Murphy's Chart Pattern Recognition
- John Murphy's Market Message
- MurphyExplainsMarketAnalysis-Intermarket Analysis
- MurphyExplainsMarketAnalysis-Visual Analysis
- StockCharts.com
- Technical Analysis of the Financial Markets
- The Visual Investor


