HOT TOPICS LIST
- Strategies
- Stocks
- Buy
- Investing
- Brokers
- Psychology
- Interviews
- Accumulate
- Sell
- Hold
- Spotlight
- Websites
- Candlestick Corner
- Gold & Metals
- Options Trading
LIST OF TOPICS
THE CHARTIST
Three Basic Chart Patterns
10/28/04 02:37:42 PM PSTby John Devcic
As you develop your chart-reading skills, here are a few basic patterns to master.
| In a recent article, "Chart Reading Basics," I introduced you to the world of chart reading. This time I want to introduce you to a few patterns you may not have heard of, but may find useful. Three elements are the same for all of the following patterns:
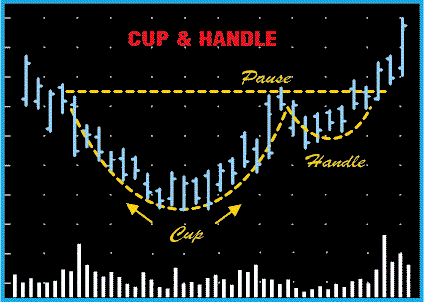
Cup with handleThe first pattern I want to discuss is the cup-with-handle pattern (Figure 1). This continuation pattern was first introduced in 1998 by William O'Neil in his book How To Make Money In Stocks.
Figure 1: Cup-with-handle. This pattern has two distinct portions. The first, formed after an advance, is called a cup because it is U-shaped; the second, called a handle, is formed after the high forms on the right side of the cup.
The pattern has two distinct portions. The first part is formed after an advance, and it is called the cup because it is U-shaped. Once the cup completes its pattern, a trading range will begin to develop. This is the second distinct portion of the pattern, and it is called the handle. From this point you should look for a breakout from the handle's trading range; this will signal a continuation of the prior advance. This is known as a continuation pattern, which means it is essential that it has a previous trend. In the best-case scenario, the prior trend should not go back further than a few months. The length of the cup-with-handle pattern itself can be as short as seven weeks or as long as 65 weeks. As far as the shape of the pattern goes, it is important that the cup be in the shape of a U and not a V. The rounded shape means that it is a consolidation pattern with valid support at the bottom of the U. The handle is created after the high forms on the right side of the cup. The handle is the final resistance before price breaks out of the trading range. The breakout can retrace up to one-third of the cup's advance. The interesting factor here is that the smaller the retracement, the more bullish the formation will be, as well as the breakout. Some chart readers recommend waiting for a breakout above the resistance line established during the formation of the cup. A perfect pattern would have equal highs on both sides of the cup. As there are few perfect shapes, though, this is usually not the case. A lack of symmetry does not disqualify it from being a cup-with-handle pattern. However, there should be a strong increase in volume on the breakout above the handle's resistance. The cup-with-handle pattern is a reliable and common pattern that I have found usually occurs at the start of a market move or after a market correction, but rarely appears at the end of a major market advance.
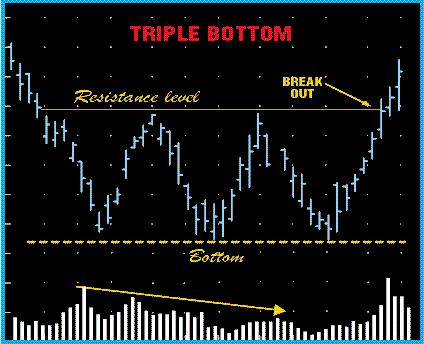
Triple bottomsThe triple bottom is a reversal pattern that is made up of three equal lows followed by a breakout above a resistance level (Figure 2). A long-term downtrend should already be in place. This pattern has a long-term nature, and will usually cover several months.
Figure 2: Triple bottom. This pattern, a reversal, is made up of three equal lows that are more or less equal.
The triple-bottom pattern requires three low points that are all somewhat equal. The lows should be well spaced, and they should all mark turning points in the equity. The three lows are not required to be at exactly the same level, but for this pattern to be useful, you need to look for three lows that are reasonably similar. What's interesting here is that the downtrend can be definitive, or it can be a slow fade that takes place after some period of sideways trading. As with most reversal patterns, this one will not be complete until there is a breakout from the established resistance level. This broken resistance can become a potential support level, and it is not unusual to see the stock test this new support level with a first correction. Volume is important here; it will usually decrease as the triple bottom pattern develops. It's not unusual to see volume increase near the lows. On the third low, you can expect to see volume expand on the advance. Remember that a sharp increase in volume can signal that there is a good chance of a breakout.
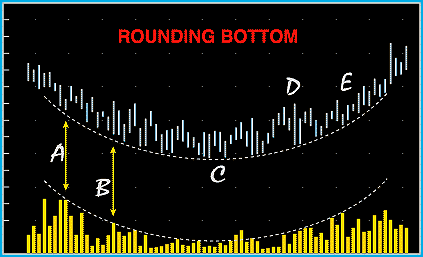
Rounding bottomsThe next pattern I want to discuss is a long-term reversal called the rounding bottom pattern (Figure 3). The rounding bottom represents a long consolidation period that turns from bearish to bullish. The first part of this pattern is the decline that leads to the low on the chart.
Figure 3: Rounding bottom. This pattern represents a long consolidation period.
This low does not have to have a specific pattern of decline. Some lows that start this type of pattern are jagged, while some trade in a more even decline. Either way, what you are looking for is a steady decline. Off of this decline will come an advance that will form the right side of the pattern and should generally take about the same time to form as the prior decline. When the pattern breaks above the high that signaled the beginning of the decline (and started the pattern), it indicates bullish confirmation. It is not uncommon to see the low of the rounding bottom pattern look like a V, as long as the shape is not too sharp. Keep an eye on volume with this pattern. Ideally, volume levels should follow the same shape as the formation. Volume should be high at the beginning of the downtrend, lower at the end of the downtrend, and move upward during the reversal.
One final notePractice, practice, and more practice is the only way to become familiar with any chart pattern. Only with practice can you become a proficient chart reader. Remember the three essential keys to these patterns:
With practice, the three patterns will become easier to identify. Good luck on your journey to becoming an expert chart reader, and who knows? In time you may be finding new patterns that will help other chart readers spot opportunities from which to profit.
John Devcic is a market historian and freelance writer. He may be reached at glatko@aol.com.
Suggested readingDevcic, John [2004]. "Understanding McClellan's Oscillator & Summation Index," Working Money: June 9. Current and past articles from Working Money, The Investors' Magazine, can be found at Working-Money.com. |
John Devcic is a market historian and freelance writer. He may be reached at drmorgus@gmail.com
| E-mail address: | drmorgus@gmail.com |
PRINT THIS ARTICLE

Request Information From Our Sponsors
- StockCharts.com, Inc.
- Candle Patterns
- Candlestick Charting Explained
- Intermarket Technical Analysis
- John Murphy on Chart Analysis
- John Murphy's Chart Pattern Recognition
- John Murphy's Market Message
- MurphyExplainsMarketAnalysis-Intermarket Analysis
- MurphyExplainsMarketAnalysis-Visual Analysis
- StockCharts.com
- Technical Analysis of the Financial Markets
- The Visual Investor
- VectorVest, Inc.
- Executive Premier Workshop
- One-Day Options Course
- OptionsPro
- Retirement Income Workshop
- Sure-Fire Trading Systems (VectorVest, Inc.)
- Trading as a Business Workshop
- VectorVest 7 EOD
- VectorVest 7 RealTime/IntraDay
- VectorVest AutoTester
- VectorVest Educational Services
- VectorVest OnLine
- VectorVest Options Analyzer
- VectorVest ProGraphics v6.0
- VectorVest ProTrader 7
- VectorVest RealTime Derby Tool
- VectorVest Simulator
- VectorVest Variator
- VectorVest Watchdog


