HOT TOPICS LIST
- Strategies
- Stocks
- Buy
- Investing
- Brokers
- Psychology
- Interviews
- Accumulate
- Sell
- Hold
- Spotlight
- Websites
- Candlestick Corner
- Gold & Metals
- Options Trading
LIST OF TOPICS
INSIDER TRADING
Insider Sell/Buy Ratio Hits All-Time High
02/23/05 01:26:09 PM PSTby Matt Blackman
The all-important sell/buy ratio hit a new all-time high in January, but is that an accurate indication of what insiders are doing?
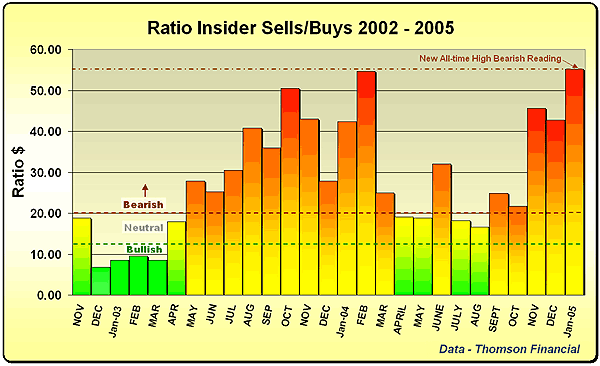
| Insider share purchases dropped to four million shares valued at just $35 million in January 2005, approximately one-third of December 2004's level. It was one of the lowest levels of buying since insider data has been recorded, according to the latest Thomson Financial Client Advisory. While a decline from December to January was expected based on seasonal patterns, the magnitude of the drop was not. Insider selling also dropped to a total of $1.9 billion, which was the second lowest level in the last two years. Overall, the ratio of share sales to purchases increased to more than $55, generating the most bearish signal on record. Thomson Financial considers the insider sell/buy ratio to be the best single overall measure of insider activity. A ratio value of $12 or below is bullish and $20 or above is bearish.
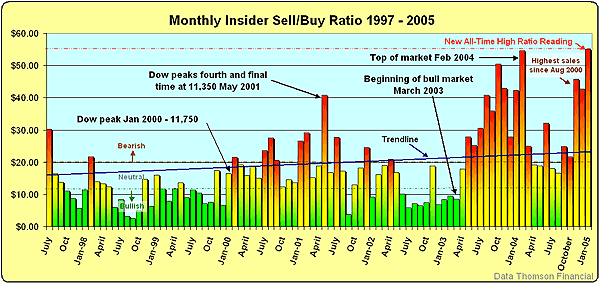
Figure 1: Monthly insider sell/buy ratio from November 2002 to January 2005. A bearish reading occurs at or above $20 in share sales for every $1 of shares bought and bullish at or below $12. Data by Thomson Financial. As I have noted in previous articles, corporate insiders sell stock to raise money for a number of reasons and will sell after the market has been good to lock in profits. Unless selling peaks occur during a bear market, they do not necessarily warn of a major market top. Taking a cue from spikes in insider selling in a bull market may be of some use in protecting profits, but shorting these spikes is highly risky. However, insiders must trade hard-earned cash to buy their company's shares, so these signals have proven to be very accurate. Utilizing insider buying peaks to go long can be highly profitable at the end of an extended bearish move when the market is showing signs of bottoming. They are also excellent signals to follow in a bull market. But even in a bear market, insider-buying spikes are useful in covering short positions or playing rallies for the more aggressive trader. Thomson Financial's James Mazzola has tracked daily inside activity going back to 1986 and believes that insider buying in small to mid-caps is a very important signal. Nevertheless, selling in large caps can be equally important, a fact that is often overlooked. He points to the period leading up to accounting scandals as a prime example, when insiders were selling at high levels in such large caps as Enron and Worldcom. Investors and traders who paid attention to these signals were out long before these companies collapsed and the market suffered a setback. In analyzing data of insider activity going back to 1990, when it first became available, I have observed an uptrend in the linear regression line in the last 15 years (see blue line in Figure 2). Insiders have shown an increasing trend of selling more stock in the last 15 years, but does this mean they expect a serious market correction or is there another reason? And are the $12 bullish and $20 bearish thresholds still valid?
Figure 2: Monthly insider sell/buy ratio from July 1998 through January 2005 showing a linear regression trendline using data from 1990, which ranges from $16 in 1998 to $22 in 2005. This reflects the increased use of options to offset transaction costs, thereby shifting the bullish and bearish thresholds higher. Data by Thomson Financial When asked about the linear regression slope on the graph of the sell/buy ratio moving from an average bullish reading below $10 in 1990 to $16 in 1997 and then into bearish territory of $22 in January 2005, Mark LoPresti, a Thomson senior quantitative analyst, replied that the skew in value was due to the increasing use of stock options. Insiders are selling an increasing number of shares to cover the costs of selling options, he noted, but this does not represent true increases in stock sales. When this change is factored in, the actual level of selling demonstrates a decline over the last few years, which LoPresti believes is actually bullish. "Acquisitions through exercise have become more and more a function of insiders' ownership activity since 1997 and therefore has muted the 'sell' effect of the sell-buy ratio," he explained. But even with recent changes in this trend and new legislation contained in the 2002 Sarbanes-Oxley Act reducing the time that insiders have to report a transaction after it occurs from as much as 30 trading days before May 2003, when the legislation took effect, to just two days now, as we see from Figure 3, insider peaks in buying and selling remain potent signals to follow.
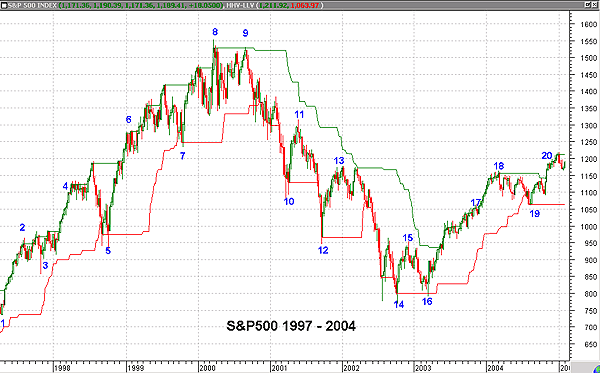
Figure 3: Weekly chart of the S&P 500 showing buying (under price) and selling peaks (over price) in the insider sell/buy ratio. Insiders have demonstrated an uncanny knack for picking market reversal and consolidation points. In 1997 through 1999, odd numbers represented buying peaks and even numbers represented selling peaks. From 2000 to the present, odd numbers represent selling peaks and even numbers represent buying peaks. Chart by MetaStock.com Does the recent peak represent a consolidation or potential reversal? The November peak was a great time to take profits, but the jury is still out on whether January's signal will be as useful. The lack of overall market buying by insiders is a concern, and what happens in February will tell us whether this is a developing trend or simply a January phenomenon. However, even if we assign the linear regression line in Figure 2 as the new bullish current threshold at $22 and add $8 to set the new bearish threshold at $30, the January level is still very bearish and should not be ignored. Like all good technical signals, confirmation is essential before they should be acted upon. In this case, a significant break in trendline or of a 50- or 200-day moving average provide reasonable corroboration.
Matt Blackman is a technical trader, author, reviewer, keynote speaker and regular contributor to a number of trading publications and investment/trading websites in North America and Europe. He can be reached at matt@tradesystemguru.com or trader@goldhaven.com.
Suggested readingBlackman, Matt [2005]. "View Of 2004 From The Inside," Working-Money.com: January 13._____ [2004]. "Insider Trading Hits Four-Year High," Working-Money.com: December 8. _____ Blackman, Matt [2004]. "What Are Insiders Telling Us?" Working-Money.com: December 1. _____ Blackman, Matt [2004]. "September Insider Update," Traders.com Advantage: October 11. Muzea, George [2005]. The Vital Few Versus The Trivial Many: Invest With The Insiders, Not The Masses, John Wiley & Sons. Penn, David [2003]. "Insiders," Working-Money.com: July 22. Seyhun, Nejat H. [2000]. "Investment Intelligence From Insider Trading," MIT Press. Thomson Financial [2005]. "January 2005 Insider Recap," Traders.com Advantage: February 3. Current and past articles from Working Money, The Investors' Magazine, can be found at Working-Money.com.
|
Matt Blackman is a full-time technical and financial writer and trader. He produces corporate and financial newsletters, and assists clients in getting published in the mainstream media. He tweets about stocks he is watching at www.twitter.com/RatioTrade Matt has earned the Chartered Market Technician (CMT) designation.
| E-mail address: | indextradermb@gmail.com |
PRINT THIS ARTICLE

Request Information From Our Sponsors
- StockCharts.com, Inc.
- Candle Patterns
- Candlestick Charting Explained
- Intermarket Technical Analysis
- John Murphy on Chart Analysis
- John Murphy's Chart Pattern Recognition
- John Murphy's Market Message
- MurphyExplainsMarketAnalysis-Intermarket Analysis
- MurphyExplainsMarketAnalysis-Visual Analysis
- StockCharts.com
- Technical Analysis of the Financial Markets
- The Visual Investor
- VectorVest, Inc.
- Executive Premier Workshop
- One-Day Options Course
- OptionsPro
- Retirement Income Workshop
- Sure-Fire Trading Systems (VectorVest, Inc.)
- Trading as a Business Workshop
- VectorVest 7 EOD
- VectorVest 7 RealTime/IntraDay
- VectorVest AutoTester
- VectorVest Educational Services
- VectorVest OnLine
- VectorVest Options Analyzer
- VectorVest ProGraphics v6.0
- VectorVest ProTrader 7
- VectorVest RealTime Derby Tool
- VectorVest Simulator
- VectorVest Variator
- VectorVest Watchdog


