HOT TOPICS LIST
- Strategies
- Stocks
- Buy
- Investing
- Brokers
- Psychology
- Interviews
- Accumulate
- Sell
- Hold
- Spotlight
- Websites
- Candlestick Corner
- Gold & Metals
- Options Trading
LIST OF TOPICS
THE CHARTIST
Wrapping Moving Averages With Ribbons
10/14/13 08:33:32 AM PSTby Bruce Tintelnot
Most traders apply moving averages to detect price trends. Here's one way you can apply several moving averages at a time to better identify turning points, continuations, extreme highs and lows, and trading ranges.
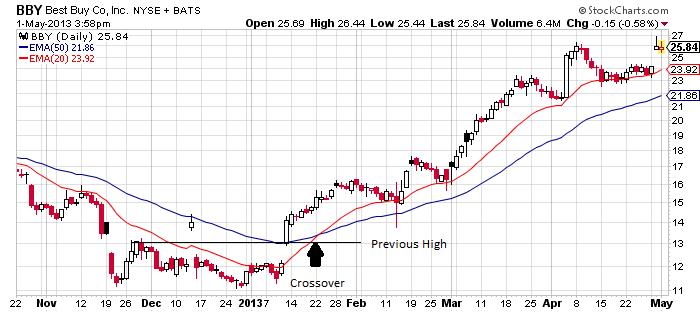
| Moving averages (MAs) are the simplest and easiest indicators to understand. They are used with price charts for measuring the trends on price charts. There is no question about their value, and many other technical indicators use them in various ways. When the price crosses over a moving average, it indicates a change in the direction of momentum and a possible change in the trend, which many traders use as buy or sell signals. This is more clearly evident when using two MAs -- a short-term MA and a long-term MA; a strong buy signal is generated when the short-term MA (20-period) crosses over the longer-term MA (50-period) MA (Figure 1).
FIGURE 1: DETECTING TRENDS. When using two moving averages, a buy signal is generated when the short-term moving average (20-period MA) crosses over the long-term MA (50-period). BIGGER IS BETTER |
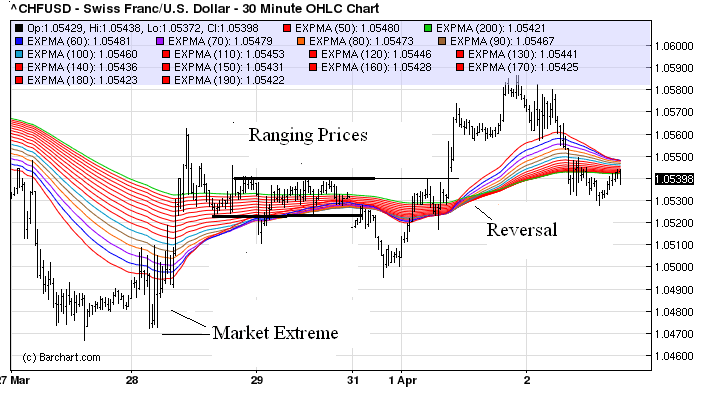
The 30-minute chart of the Swiss franc/US dollar (CHFUSD) in Figure 2 shows a long-term MA ribbon with crossovers forming folds in the ribbon and other changes in momentum creating wide and narrow areas. The general ribbon patterns are:
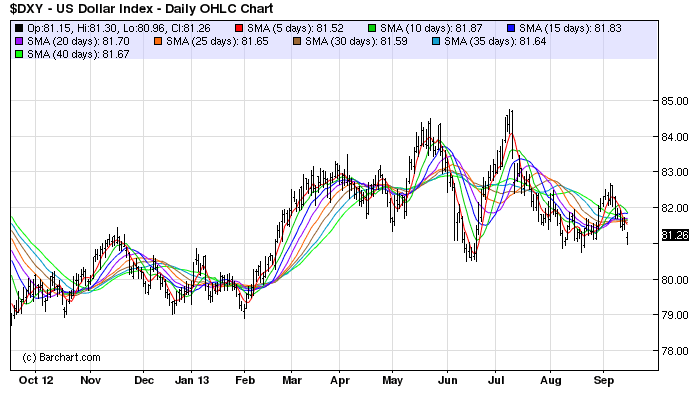
FIGURE 2: FOLDS AND FANS. A fold in the ribbons indicates a reversal is likely; when spaces between moving averages (MAs) are spread apart equally, the trend is strong; when spaces between MAs widen, it suggests a market extreme; and when spaces between MAs become narrow and constricted, it suggests that prices are ranging. One practice shown in Figure 2 that can help with viewing an MA ribbon is to make the 50-period MA a different shade or color from the other lines. When prices are ranging, showing narrow bands, it is easier to see if the 50-period band is going to cross or remain below the other averages, giving a hint of where the breakout or pullback might occur. If other MAs follow, then it is likely that momentum will increase in that direction. Short-term moving average ribbons can also be useful. The nice thing about using MA ribbons is that the averages can be any combination you choose. They are usually between zero and 50. One useful combination might be the 5-10-15-20-25-30-35-40, such as what you see in the daily chart of the US dollar index in Figure 3. You could also use other combinations such as 5-10-20-30-40-50. As you may have already suspected, these behave similar to long-term MA ribbons, but they are more sensitive to price changes and react to them sooner. This is helpful in determining short-term entries and exits.
FIGURE 3: SHORT-TERM MOVING AVERAGES. This combination of MAs is usually between zero and 50. Here you see a 5-10-15-20-25-30-35-40 combination of MAs. These MAs closely follow price and are more sensitive to price changes. |
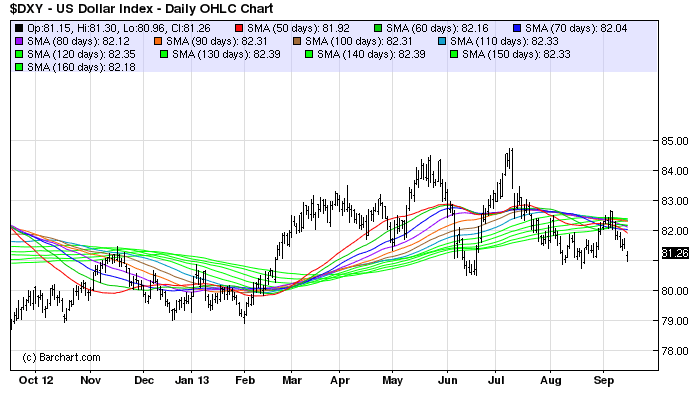
| THE LONG AND SHORT OF IT Short- and long-term MA ribbons can be unquestionably useful for their respective traders, but combining them using colors to distinguish the short-term indicators from the long-term can provide a more in-depth perspective on a price chart. In the daily chart of the US Dollar Index in Figure 4, the longer-term MAs are displayed in green. This makes it easy to identify when short-term moving averages begin crossing into long-term territory, which can be an early warning of a reversal. Trend changes are obvious when the shorter-term averages change position from being on the bottom of the long-term averages to the top, or from top to bottom.
FIGURE 4: LONG-TERM MOVING AVERAGES. Here, the long-term MAs are displayed in green, making it easy to identify when short-term MAs cross into long-term territory. |
| SUMMARY MA ribbons are easy to understand and market fluctuations are much more distinctly displayed when using MA ribbons. This makes it easier to arrive at decisions than when using just one or two them. As the momentum increases, more MAs shift toward the direction of price movement and the spacing between them will increase as a market extreme is reached. The wide spacing of a market extreme is followed by a reversal of prices in the opposite direction that can be just a pullback indicated by crossovers in the short-term MAs or a trend reversal indicated by crossovers in the longer-term ones. A wider spacing is indicative of a faster and steeper movement in the opposite direction. This alone can make ribbons a useful tool in any trader's toolbox. FURTHER READING
Charts courtesy of Barchart.com |
Bruce Tintelnot is a private trader and freelance writer.
PRINT THIS ARTICLE

Request Information From Our Sponsors
- StockCharts.com, Inc.
- Candle Patterns
- Candlestick Charting Explained
- Intermarket Technical Analysis
- John Murphy on Chart Analysis
- John Murphy's Chart Pattern Recognition
- John Murphy's Market Message
- MurphyExplainsMarketAnalysis-Intermarket Analysis
- MurphyExplainsMarketAnalysis-Visual Analysis
- StockCharts.com
- Technical Analysis of the Financial Markets
- The Visual Investor
- VectorVest, Inc.
- Executive Premier Workshop
- One-Day Options Course
- OptionsPro
- Retirement Income Workshop
- Sure-Fire Trading Systems (VectorVest, Inc.)
- Trading as a Business Workshop
- VectorVest 7 EOD
- VectorVest 7 RealTime/IntraDay
- VectorVest AutoTester
- VectorVest Educational Services
- VectorVest OnLine
- VectorVest Options Analyzer
- VectorVest ProGraphics v6.0
- VectorVest ProTrader 7
- VectorVest RealTime Derby Tool
- VectorVest Simulator
- VectorVest Variator
- VectorVest Watchdog


