HOT TOPICS LIST
- Strategies
- Stocks
- Buy
- Investing
- Brokers
- Psychology
- Interviews
- Accumulate
- Sell
- Hold
- Spotlight
- Websites
- Candlestick Corner
- Gold & Metals
- Options Trading
LIST OF TOPICS
DOW THEORY
Nonconfirmations And Back Again
10/20/06 03:52:47 PM PSTby David Penn
Nonconfirmations follow nonconfirmations ... will the transports follow the industrials?
| There is a tendency to treat nonconfirmations between the Dow industrials and the Dow transports the same way we treat divergences between markets and indicators (see my article "Dial D For Divergences," Working-Money.com, March 8, 2006, for a primer on divergences between markets and indicators). This tends to encourage simplistic analysis like this: If the industrials make a new high and the transports don't, then the industrials are headed for a significant correction. Clearly this analysis sometimes proves correct. But is it an accurate understanding of the principle of nonconfirmation in Dow theory? I've quoted Robert Edwards and John Magee (authors of Technical Analysis Of Stock Trends) before on nonconfirmations, but a refresher is probably in order. This excerpt finds the authors speaking about a specific incidence of "nonconfirmation," but the point they make is broadly applicable: When prices began to work upward in June, many commentators seized upon this "failure to confirm" as a bullish omen and the wishful thinkers again talked Bull Market. There is an unfortunate tendency in "the street" to overstress any such divergence, particularly when it can be twisted into a favorable sign. The fact is that, in Dow Theory, the refusal of one average to confirm the other can never produce a positive signal of any sort. It has only negative connotations. Two terms in the final two sentences bear clarification. By "positive signal," Edwards and Magee did not mean "bullish or bearish"; instead, they simply meant "reliable directionality." So when they wrote "can never produce a positive signal of any sort," we can interpret that to mean that nonconfirmations do not suggest direction or, by implication, a change of direction. In addition, when they wrote that nonconfirmations have "only negative connotations," Edwards and Magee again do not mean bullish or bearish. These "negative connotations" refer only to the ability of a nonconfirming average to cast doubt on the "positive" signal of the current direction. For example, if we have an average that is trending upward and the other average begins to diverge, the Dow theorist would maintain his or her bullish opinion of the initial average in spite of the nonconfirmation. The potential negative connotation lies in the possibility that the initial Dow average may turn down and join the other average's decline. However, unless and until the initial Dow average does so and confirms the movement of the other average, the Dow theorist must continue to give the benefit of the doubt to the bulls who are moving the initial average higher. |
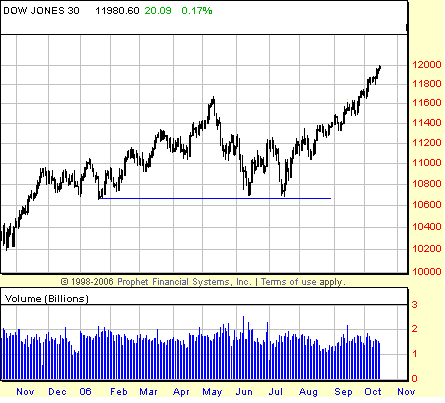
| THE SUMMER CORRECTION The Dow industrials and transports in the second half of 2006 have so far provided a textbook case of how tricky nonconfirmations can be. Both the industrials and the transports peaked in May and, as they corrected into June, seemed very much in-gear with each other. Both the industrials and the transports took out their April lows on an intraday basis in late May (on the same day, May 24) and bounced over the balance of the month. However, as both averages began falling again in June, the correction that developed in the industrials was much more pronounced. After the closing highs in June (June 1 in the industrials, June 2 in the transports), both averages fell for the next several days -- the industrials fell seven out of the next eight days before bottoming near mid-June, while the transports fell seven out of seven. As alike as their corrections were, it was the severity of the correction in the industrials that stood out. While the Dow transports merely took out the April lows on a closing basis (and challenged the March lows), the Dow industrials crashed not only through the April lows, but through the March and February lows, as well. |
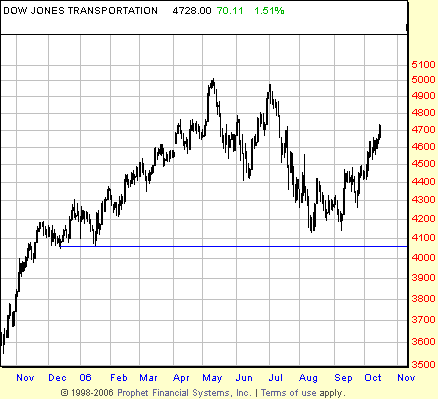
 FIGURE 1: DOW JONES INDUSTRIAL AVERAGE, DAILY. Although both sharp and sudden, the early summer correction in the industrials failed to take out a key low from January 2006. This meant, among other things, that the bull market that began in October 2005 was still intact. As severe as the correction in the industrials was, it is noteworthy that the correction did not take out the low of January 2006. This suggested that the bull market that had begun in the autumn of 2005 was still intact. The low of January 2006 marked the end of a secondary correction in that bull market and a close beneath that low would have been damaging to the bull case -- damaging but per Dow theory not necessarily lethal as long as the transports failed to confirm. In comparison, the Dow transports came nowhere near testing their January 2006 lows during the May-June correction. While it could be argued the two averages were not confirming each other in the early summer of 2006 because of the disparity between the number of prior monthly lows that were taken out, the fact that the January 2006 lows held in both the industrials and the transports suggests that any nonconfirmation based on the May-June correction had to be kept in its relatively minor context. The July (or, rather, the July-August) correction that followed initially seemed capable of bringing some level of confirmation back to the averages. The industrials bounced mildly in the second half of June, not even establishing a new June high, while the transports seemed to explode to the upside, not only taking out the June highs but making a very real challenge of the May highs as well. The May closing high was 4998.95. The June-July rally brought the transports to a closing high of 4974.91. These moves higher -- peaking in earliest July -- were met with another correction over the course of July. At first, this appeared to be another opportunity for confirmation. As the averages moved lower, the question for Dow theorists was whether both would take out their June lows, a move that would be a clear-cut bearish confirmation going forward. The transports, which had showed strength relative to the industrials in the first half of the summer, made up for it in the second half by plunging below their June lows late in July and into the first half of August. But this time, it was the industrials that showed resilience as they found support just north of their June lows and began moving higher by mid-July while the transports were still falling. |
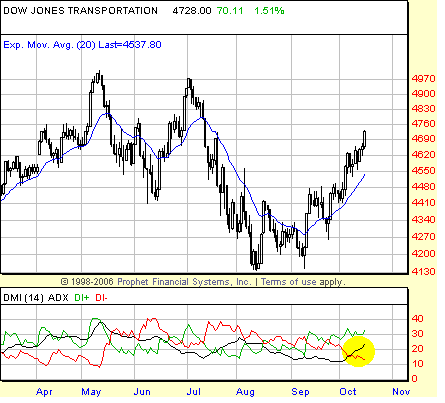
 FIGURE 2: DOW JONES TRANSPORTATION AVERAGE, DAILY. Months after making a new all-time high in May, the transports moved sharply lower and erased virtually all of the year's gains. Still, the May-August correction did not set a new low for the year, paving the way for the bounce traders have enjoyed since the August lows and the September retest. Another nonconfirmation? Insofar as the industrials failed to confirm the transports move below the June lows, yes. But rather than being a bullish nonconfirmation -- which Edwards and Magee would suggest is the wrong way to think about nonconfirmations -- if we consider the broader context it is apparent that whatever bearish clues were derived from the industrials' failure to confirm the transports' move higher in late June may have been derived erroneously. The summer correction of 2006, which began in May and ended in June in the industrials (with a steep retest of the lows in July) and ended in August in the transports, was just that: a correction in a bull market that is only now nearing its one-year anniversary. CONFIRMING FORWARD If there is -- or should be -- a mantra for Dow theorists, then that mantra should probably be "Confirmations count." As such, whenever a trader, investor, or analyst is looking at the market through a Dow theory lens, one of the chief goals should be spotting and following up on confirmations between the industrials and transports. If it is true that, as Edwards and Magee wrote, "no valid signal of a change in trend can be produced by the action of one average alone," then there can be nothing more vital to the Dow theorists than to see one average set a new high or low, find support or encounter resistance, and then wait and watch as the other average, be it in a matter of minutes, days or weeks, follows suit. That is very much the mode of the Dow theorist in mid-October, or so it seems. Half the industrials have set a new all-time high in the first week of October 2006 and did so at a time when the transports were trading some 8% below its own all-time highs. The question for Dow theorists is: Will the transports confirm the new all-time high of the industrials? Some of the ways to answer this question take us outside the world of Dow theory and into the realm of technical analysis more generally applied. One of the things that sticks out is how the transports, some 490 points from their August bottom, still show a relatively tame average directional movement index (ADX). The ADX, which I've written about a number of times recently for Working-Money.com ("What's In A Trend?" September 12, 2006; and "Trading DI+/-" October 12, 2006), is a handy tool for the market technician insofar as the indicator provides a good sense of when a market is moving from a relatively trendless to a relatively trending state. J. Welles Wilder, who originally developed the idea of directional movement, initially saw his creation as a way of screening better trading candidates from less deserving candidates. Wilder wrote: Think of the implications of being able to rate the directional movement of any or all commodities or stocks on a scale of zero to one hundred. If you use a trend-following method, you would trade only those commodities that are in the upper end of the scale ... Others have taken Wilder's notion of directional movement as a screen and run with it, albeit in a slightly different direction. Traders such as Price Headley and Linda Bradford Raschke and others have instead sought out markets with particularly low directional movement and -- treating low-directional movement the same way that others treat low volatility -- examined the potential for a shift toward greater directional movement. While low-directional movement in and of itself may disqualify a market, a low but rising directional movement can be the precursor to a strong, new trend. |
 FIGURE 3: DOW JONES TRANSPORTATION AVERAGE, DAILY. The fact that the ADX remains at a relatively low level as the transports move higher is one indication that the advance in this average still has room to run. I think of this as I look at the transports. Again, more than 490 points from the August bottom and having retraced almost 61.8% of the decline from the all-time May 2006 highs -- yet the directional movement of the transportation average is barely over 20. In fact, using the entry methods described in "Trading DI+/-" we can see that the last DI+ versus DI- crossover buy signal was on September 13, and the confirmation buy signal (ADX crossing over the DI- line) was on October 6. Compare this to the crossover buy signal in the industrials (July 25) and the last confirmation buy signal (August 21). The industrials have been in bull market mode ever since, fully eight weeks after the last directional movement buy signal. While this doesn't mean the transports will still be advancing eight weeks after its last directional movement buy signal on October 6, it does suggest that the transports have plenty of trend to go before the ADX reaches the sort of relatively extended levels (at least the 35-40 range) that the industrials have reached without bearish incident, so to speak. As I wrote in a Traders.com Advantage article on the airlines index ("Cleared For Takeoff?" September 27, 2006), one of the clues as to whether the transports will be able to continue to move higher can be found in the fortunes of crude oil. Although many of the stocks of oil companies have found support -- or at least stopped going down on a daily basis -- many investors refused to sell these stocks as they moved lower, thus making it less likely there are hordes of willing buyers waiting on the sidelines to scoop up depressed oil shares. As such, there is a very good chance that after some temporary levitation, these stocks will resume their descent. If that happens, the most direct beneficiaries will be in the transports. But additional beneficiaries might be found among those Dow theorists who know that higher and higher stock prices are only a confirmation away. David Penn may be reached at DPenn@Traders.com. SUGGESTED READING Edwards, Robert D., and John Magee [2001]. Technical Analysis Of Stock Trends, 8th ed., W.H.C. Bassetti, ed. Saint Lucie Press. Sperandeo, Victor [1991]. Trader Vic: Methods Of A Wall Street Master, John Wiley & Sons. _____ [1994]. Trader Vic II: Principles Of Professional Speculation, John Wiley & Sons. Wilder, J. Welles [1978]. New Concepts In Technical Trading Systems, Trend Research. ‡ Prophet Financial Systems |
Technical Writer for Technical Analysis of STOCKS & COMMODITIES magazine, Working-Money.com, and Traders.com Advantage.
| Title: | Traders.com Technical Writer |
| Company: | Technical Analysis, Inc. |
| Address: | 4757 California Avenue SW |
| Seattle, WA 98116 | |
| Phone # for sales: | 206 938 0570 |
| Fax: | 206 938 1307 |
| Website: | www.traders.com |
| E-mail address: | DPenn@traders.com |
Traders' Resource Links | |
| Charting the Stock Market: The Wyckoff Method -- Books | |
| Working-Money.com -- Online Trading Services | |
| Traders.com Advantage -- Online Trading Services | |
| Technical Analysis of Stocks & Commodities -- Publications and Newsletters | |
| Working Money, at Working-Money.com -- Publications and Newsletters | |
| Traders.com Advantage -- Publications and Newsletters | |
| Professional Traders Starter Kit -- Software | |
PRINT THIS ARTICLE

Request Information From Our Sponsors
- StockCharts.com, Inc.
- Candle Patterns
- Candlestick Charting Explained
- Intermarket Technical Analysis
- John Murphy on Chart Analysis
- John Murphy's Chart Pattern Recognition
- John Murphy's Market Message
- MurphyExplainsMarketAnalysis-Intermarket Analysis
- MurphyExplainsMarketAnalysis-Visual Analysis
- StockCharts.com
- Technical Analysis of the Financial Markets
- The Visual Investor
- VectorVest, Inc.
- Executive Premier Workshop
- One-Day Options Course
- OptionsPro
- Retirement Income Workshop
- Sure-Fire Trading Systems (VectorVest, Inc.)
- Trading as a Business Workshop
- VectorVest 7 EOD
- VectorVest 7 RealTime/IntraDay
- VectorVest AutoTester
- VectorVest Educational Services
- VectorVest OnLine
- VectorVest Options Analyzer
- VectorVest ProGraphics v6.0
- VectorVest ProTrader 7
- VectorVest RealTime Derby Tool
- VectorVest Simulator
- VectorVest Variator
- VectorVest Watchdog
