HOT TOPICS LIST
- Strategies
- Stocks
- Buy
- Investing
- Brokers
- Psychology
- Interviews
- Accumulate
- Sell
- Hold
- Spotlight
- Websites
- Candlestick Corner
- Gold & Metals
- Options Trading
LIST OF TOPICS
SECTOR SPOTTING
Jumpin' Nat(ural) Gas
02/20/07 04:44:36 PM PSTby David Penn
Few sectors are as seasonally favored at this time of the year as are natural gas stocks. How are they shaping up technically?
| A new year is often a time to start fresh, a time for new plans and resolutions. In the investment world, starting anew at the beginning of a new year is a little trickier. While there are trading notions like the January effect that traders can pay attention to, as well as the annual reconfiguring of the Dogs with the Dow portfolio, there are precious few sectors that speculators and investors can get excited about in the first few months of the year. That is-- Save for natural gas stocks, that is. A great number of sectors tend to begin their most favorable seasonality in the autumn, particularly September and October. But at the beginning of the year, according to the work of Yale and Jeffrey Hirsch in their Stock Trader's Almanac, only natural gas presents itself as an opportunity for traders to get in on a potential sector rotation early. According to the Hirsches, natural gas -- as measured by the natural gas index, $XNG -- has favorable seasonality between the beginning of February through the beginning of June. The returns during this seasonal period are impressive, with an average 10-year return of more than 19% and a five-year return of more than 10%. At a time when a great many investors are pondering the fortunes of tech stocks, or waiting impatiently for homebuilders to bounce, those who turn their attention to the natural gas stocks may find themselves pleasantly surprised at what kinds of opportunities the first few months of the new year may bring. GAS AU NATURALE The last time I wrote about natural gas in any context was an article for Traders.com Advantage in October 2005 ("About That Gas," October 6, 2005). In that article, I pointed out a battle between the bulls and bears in the wake of a year-long advance in natural gas that had seen the commodity move from under five (basis continuous futures) to over 14. At the time, I concluded: What is different about the most recent late September peak is that there is also a negative divergence in the MACDH. While I tend to put more weight on stochastic divergences than MACDH divergences -- at least on daily charts -- the fact that the MACDH is decreasingly bullish (smaller positive values) is another warning that the bull run in natural gas might be closer to its conclusion than many energy traders think. An apt conclusion, as a picture-perfect 2B top in the fourth quarter of 2005 led to a bear market that completely retraced the October 2004-December 2005 bull market. In fact, by late September 2006, natural gas was trading lower than it was in September 2004 (again, basis continuous futures). |
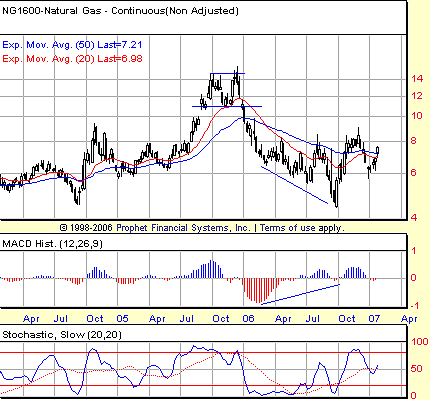
 FIGURE 1: NATURAL GAS, CONTINUOUS FUTURES, WEEKLY. A 2B top in the fourth quarter of 2005 led to a major bear market that completely retraced the previous advance. Note also the positive divergences throughout 2006, which suggest that the autumn bottom in 2006 will be a lasting one. It is this bear market that appears to be the beginning of a renewed move higher in natural gas. Note the chart of weekly continuous natural gas futures in Figure 1. Throughout the entire course of 2006, natural gas futures were making lower lows in price, while making higher lows in the moving average convergence/divergence (MACD) histogram. MACD histogram divergences in weekly charts are some of the best, most powerful divergences speculators can follow, which bodes well for the late September-early October bottom in 2006. The March 2007 contract for natural gas is where speculators should look for a closer sense of where the commodity is right now. That contract also shows positive divergences -- between the October 2006 and January 2007 lows -- that similarly suggest that natural gas will be headed higher before it is headed lower. |
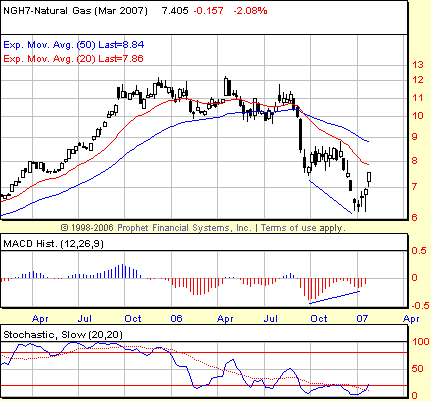
 FIGURE 2: MARCH NATURAL GAS FUTURES, WEEKLY. Breaking down from a major consolidation between October 2005 and the late summer of 2006, March 2007 futures fell from a consolidation high above 12 to almost six by early 2007. A positive divergence in the MACD histogram strongly suggests that a bottom was made just as the new year was beginning. The bounce in March natural gas futures that was produced by the positive divergence in the MACD histogram is a sharp one, so sharp it is likely to run into some measure of resistance as prices try to break through the 8 to 9 level. Actually, it wouldn't be surprising at all to see the March contract move similarly to the way the continuous futures contract did after it broke through resistance in November 2006 -- breakthrough, pull back sharply, then advance again. The presence of downwardly sloping moving averages (the 20-week and the 50-week in red and blue, respectively) suggests there will be plenty for natural gas bulls to fight through between 8 and 9 before this market will be able to move higher -- though "move higher" is exactly what the market seems poised to do, technically as well as seasonally. STOCKS LEADING FUTURES One of the lessons of intermarket analysis is that the stocks of certain commodities tend to lead those commodities in both uptrends and downtrends. While some like to posit that stocks "always" lead the underlying commodity, John Murphy, the leading authority on intermarket technical analysis, noted in Intermarket Technical Analysis that there are instances in which stocks lead, but also instances during which the commodity leads. Much more important, Murphy reminded us, is to know that "as a rule, they both trend in the same direction. When they begin to diverge from one another, an early warning sign is being given that the trend may be changing." |
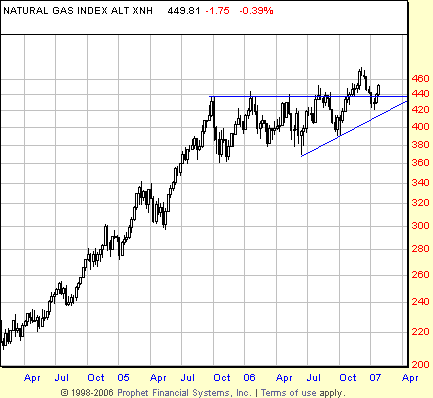
 FIGURE 3: NATURAL GAS INDEX, WEEKLY. While natural gas futures were moving sharply lower in 2006, natural gas stocks slipped into a horizontal consolidation -- and one with an upward bias as the higher lows beginning in the second quarter of 2006 attest. Bringing Murphy's observations on the relationship between commodities and commodity stocks to bear on the behavior of natural gas and natural gas stocks in 2006, we can see that while the commodity was breaking down significantly (the March 2007 contract was nearly halved), the stocks were holding their own. In fact, it could be argued that while the stocks were in a sort of consolidation pattern for all of 2006 (and the last quarter of 2005 as well), that consolidation had a bullish bias. I suggest that because of the pattern of higher highs and higher lows that became increasingly apparent in the consolidation range of the natural gas stocks. This trend became especially pronounced after the late spring low in 2006 -- which itself was a higher low vis-a-vis the fourth-quarter 2005 low. The resilience of the stocks suggested strongly that when the correction in natural gas as a commodity was over, the consolidation in natural gas stocks would be over also. And what would be a bounce from severely oversold conditions in the former would be a breakout to new highs in the latter. Looking more technically at the consolidation range in the natural gas stocks, the index of which goes under the symbol $XNG, we note a breakout in the fourth quarter of 2006, then a pullback to just inside the top of the consolidation range. There is trendline support nearby, which should make it difficult for the pullback to fall too much deeper into the consolidation range, At any rate, it appears as if a pivot low has been established at 420 from the very first trading week in January 2007. This, too, should provide comfort for the bulls trying to move natural gas stocks out of their consolidation. The size of the consolidation range suggests that should the $XNG regain momentum to the upside, a move to the 500 level should be expected (that is, a basic swing rule projection: take the width of the consolidation and add that amount to the value at the top of the consolidation to get an upside target. In order to get downside targets, simply subtract that same amount from the value at the low of the consolidation). If a breakout is in the cards for natural gas stocks, then which stocks seem best poised to exploit that breakout? Of the 15 $XNG stocks I track, fully eight have produced buy signals based on the weekly MACD histogram (see my pair of Working-Money.com articles "Trading The MACD Histogram, Part I" and "Trading The MACD Histogram, Part II" for more on histogram-based buy and sell signals). And five out of that eight have been trading above their intermediate- and long-term moving averages (20- and 50-week exponential moving averages), and thus may be the cream of the natural gas stock crop for those looking to gain exposure to the group. These five include Devon Energy (DVN), Noble Energy (NBL), Natural Fuel Gas Company (NFG), Southwestern Energy (SWN), and XTO Energy (XTO). |
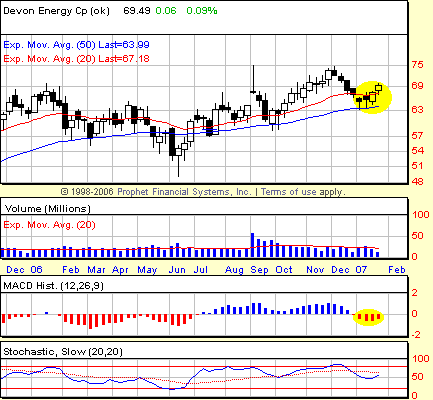
 FIGURE 4: DEVON ENERGY, WEEKLY. Bouncing off of support at the 50-week EMA, shares of Devon Energy look set to test the 2006 highs near the 75 level. I purposely have used weekly charts in order to cater to speculators and position traders who prefer to operate on a somewhat longer, less hectic time frame compared to the sort of signals and reads usually generated from daily charts. I also suspect that, as was the case with my timely calls on consumer stocks back in the spring of 2006 ("Counting On Consumers," Working-Money.com) and biotechnology stocks a month or so later ("Betting On Biotech," Working-Money.com), weekly charts are an excellent way to read and analyze longer-term seasonal trends. Longer time frames do mean that speculators and investors have to tolerate greater price swings than swing traders, for example, who might play for only a point or two worth of gain. But it is also true that longer time frames can allow the sort of time stocks often require in order to make their biggest moves. And with both seasonal and technical winds at their back, stocks likely to make these sort of moves are often best left to their own devices until the end of seasonality or a change in the technicals tells traders otherwise. David Penn may be reached at DPenn@Traders.com. Charts by Prophet Financial |
Technical Writer for Technical Analysis of STOCKS & COMMODITIES magazine, Working-Money.com, and Traders.com Advantage.
| Title: | Traders.com Technical Writer |
| Company: | Technical Analysis, Inc. |
| Address: | 4757 California Avenue SW |
| Seattle, WA 98116 | |
| Phone # for sales: | 206 938 0570 |
| Fax: | 206 938 1307 |
| Website: | www.traders.com |
| E-mail address: | DPenn@traders.com |
Traders' Resource Links | |
| Charting the Stock Market: The Wyckoff Method -- Books | |
| Working-Money.com -- Online Trading Services | |
| Traders.com Advantage -- Online Trading Services | |
| Technical Analysis of Stocks & Commodities -- Publications and Newsletters | |
| Working Money, at Working-Money.com -- Publications and Newsletters | |
| Traders.com Advantage -- Publications and Newsletters | |
| Professional Traders Starter Kit -- Software | |
PRINT THIS ARTICLE

|

Request Information From Our Sponsors
- StockCharts.com, Inc.
- Candle Patterns
- Candlestick Charting Explained
- Intermarket Technical Analysis
- John Murphy on Chart Analysis
- John Murphy's Chart Pattern Recognition
- John Murphy's Market Message
- MurphyExplainsMarketAnalysis-Intermarket Analysis
- MurphyExplainsMarketAnalysis-Visual Analysis
- StockCharts.com
- Technical Analysis of the Financial Markets
- The Visual Investor
- VectorVest, Inc.
- Executive Premier Workshop
- One-Day Options Course
- OptionsPro
- Retirement Income Workshop
- Sure-Fire Trading Systems (VectorVest, Inc.)
- Trading as a Business Workshop
- VectorVest 7 EOD
- VectorVest 7 RealTime/IntraDay
- VectorVest AutoTester
- VectorVest Educational Services
- VectorVest OnLine
- VectorVest Options Analyzer
- VectorVest ProGraphics v6.0
- VectorVest ProTrader 7
- VectorVest RealTime Derby Tool
- VectorVest Simulator
- VectorVest Variator
- VectorVest Watchdog
